Davis VP2, 4/10/06 firmware. I’m at an elevation of 6978 ft and noticed a dip in the barometer reading on the hour, usually between 7 pm and 12 am and occasionally other times.
I contacted Davis a couple of weeks ago and emailed them my data from Weatherlink V5.7a. (I run WL & WD via Virtual VP) They replied that they wanted to monitor the prob with my console and would ship me a new one. I received the new console yesterday and received this email today from Davis:
“We were able to reproduce the problem. The console swap won’t solve anything.
This is a firmware and calculation issue. The problem arises from the temp
compensation being applied using a 12 hour average temperature variable.
Apparently this is the preferred way to make this calculation. Normally the
barometer jump you saw wouldn’t be noticed under by customers at low altitude
or customers using a long archive period. At high elevation and using a 1
minute archive period makes the temp compensation calculation apparent on the
hour. I’m not sure when or if this will be changed in the firmware. You can
get around this though by not using temperature compensation. To do this, set
the elevation to zero and recalibrate the barometric pressure reading.”
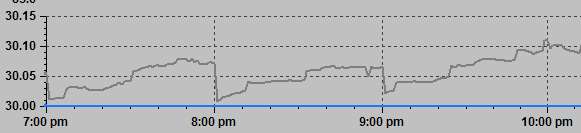
I have emailed back, expressing my disappointment in what seems to be a lack of enthusiasm to fix this problem. This post is basically for your information in case you are seeing baro dips. I would encourage you to contact Davis as I hope that the more people they hear from, the more motovated they will be to correct this. Below is a graph of baro dips at 8 pm and 9 pm in WL. WD displays the same dips.
I would like to analyze the interesting barometer data you’re seeing. Since it sounds like you’re running VPLive, it would be easy for you to do. Just enable barometer logging (Settings/Preferences menu), let it run for a few days, and then email me a copy of the barometer.csv file in the VPLive folder.
I’ve spent a fair amount of time analyzing the VP barometer output, and I have seen hour boundary anomalies that are artifacts of the method used in the console to calculate SLP, but nothing as extreme as you’re seeing. After I get the log, I let you know if I find anything interesting.
The reason I determined for the anomalies I saw is that the console doesn’t really use a 12 hour mean temperature (which is what the SLP calc needs). They use a psuedo 12 hour mean. It’s the mean between the temperature now and the temperature at the top of the hour near 12 hours ago. I’m guessing this is because they are using the temp values already available in the graph data memory. If they didn’t use that, they’d have to come up with a whole new chunk of memory that stored a more dense array of temperature over 12 hours. Since the barometer defaults to 15 minute updates, it would be more ideal to store 12 hours of temperature every 15 minutes (12 * 4 = 48 values). By using top of the hour temperature for calculating the mean temp, there can be a jog in the barometer at the top of the hour when the formula moves to using a temp 1 hour past the one it used for the previous calculation. If you have big fast temperature swings, the effect is more noticable.
The log file contains everything related to the barometer and the sensor values that are used in the SLP calculation. One of the things I’m interested in seeing is if the Altimeter calculated by VPLive shows the same dips. It shouldn’t because it is the result of backing out the SLP calculation (which is affected by temperature), and calculating the altimeter (which doesn’t use temperature). The barometer.csv file can be imported into excel, which you can then use to graph the raw pressure, altimeter, and SLP values over time. VPLive writes an entry every time the barometer changes, so all values are captured.
Ok, didn’t know you were already using VPLive. I mentioned it because I didn’t think VPLive would be using the temps stored in the console so, in theory, you wouldn’t see the problem. After reading Steve’s response I guess my thinking was not correct.
Also I do not see the same problem here at 1300 feet. Makes me wonder at what altitude this problem becomes evident.
Hi Brian. From what I was told I enter 0 in elevation in the console barometer setup and then the console does not factor in temperature into the barometer reading. I did that when I first got the vp2 and it seems at higher pressure readings it did not track my local airport (altimeter pressure) very well.
I may go back to that but I asked the tech, I have been dealing with at Davis, to express my dissapointment in not correcting this prob to the “higher ups”. Curious to see if anything happens. Thanks for your input.
The 0 elevation thing is not the greatest advice in my opinion. The altimeter calculation is more complicated than simply adding a fixed offset to the station pressure (which is what they are, in effect, saying). Especially at higher altitudes, you will only match the airport when the pressure is what it was when you calibrated to the airport. The further the pressure departs from that point, the less your console will match the airport’s altimeter. For example, even at only 1000 ft., at around an altimeter of 30.00 inHg, the difference between the sensor pressure and the calculated altimeter value is about 1.06 inHg. But when the altimeter is around 29.00 inHg, the difference is 1.03 inHG. In other words, if you calibrated your station to the airport as they suggest when the pressure was 30.00 inHg, your console would read .03 inHg above the airport after a low pressure system moved in. It’s worse at higher elevation. At 5000 ft, you’d be off by .14 inHg after a pressure change of 1 inHg.
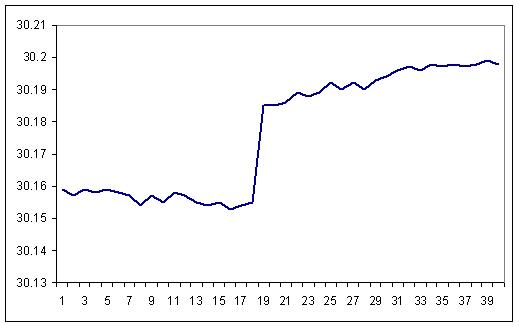
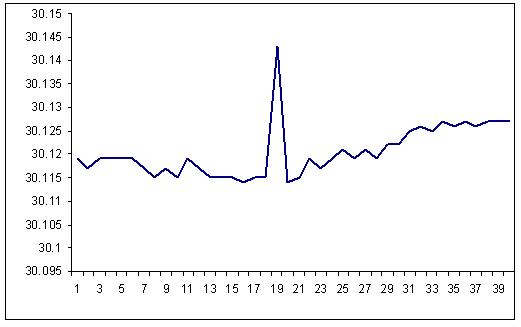
Thanks for sending the barometer data. It confirmed my suspicion, and also what Davis was saying. What you are seeing is an artifact of the console’s method for calculating the sea level pressure (SLP). As you probably know, VPLive calculates the altimeter by backing out the console’s SLP calculation to determine the raw pressure, and then uses that to calculate the altimeter value. If the anomaly you were seeing was in the sensor, then both the altimeter and the SLP would show the same problem. If it was the SLP calculation, then the SLP would show it, but not the altimeter. I’ve included two charts from the period 6:30 am to 7:30 am on 9/23. One is the SLP, the other is the altimeter.
You will note that there is a brief spike in the altimeter. This is the data point logged right after VPLive got the changed SLP value. When VPLive detects the SLP value has changed, it immediately requests the data from the console that it needs to recalculate the altimeter. The following data point that is not spiked actually is logged a fraction of a second after the spiked one.
The console uses the 12 hour mean temp in its calculation. However, although it uses the current temp to calculate that, it only uses the temp on a one hour boundary for the 12 hour ago temp. It also uses integer temperatures.
In your data, the temp at 7pm was 44, and at 8pm was 40. So when the console switches from using one to the next, there is a 2 degree jog in the resultant mean temp. This 2 degree jog’s effect in the SLP calculation is sufficient to cause the anomaly you see.
Davis could solve this if they were truly wished to. They would only need to store 12 hours of temperature history a little more densely - say every quarter hour instead of only every hour. That would probably be enough to make this go away.
It would be interesting to add a new field to VPLive’s display of what the SLP would be, using the console calculation’s formula, but with the true 12 hour mean temperature. It would make the discrepency easy to see. Then (since Brian has my formula code and permission to use it) folks could bug him to add the feature that uses the calculated SLP instead of the console’s
You’re doing the altimeter right. My somewhat tongue in cheek suggestion was that since the console doesn’t always calculate the sea level pressure (what is displayed on the console) in an ideal manner, maybe WeatherDisplay could calculate the proper sea level pressure in addition to calculating the altimeter (which WD can now do for CWOP submission). Since WD already calculates the raw pressure for calculating the altimeter, it could use the raw pressure to calculate the SLP too. I wasn’t entirely serious though. I’m sure there are more generally useful features for you to spend time on. I think I might add it to VPLive though, just for kicks, if it’s easy.
Steve, thanks for looking over my data and spending time on this. I appreciate the insight as to how this all works ( which I didn’t know).
Brian, if you can easily add a SLP calculation to the raw baro pressure in WD so I get rid of my dips, I would appreciate it. It seems, though, I am the only one asking, so may not be worth the time. Thanks.
niko, I received an email from the tech at Davis and he said he did not know at what elevation or what data interval setting (on the console) would make this prob go away.
I was thinking Steve might have an idea based on his understanding of the formulas. I’m pretty sure Davis could have figured it out too if they wanted.