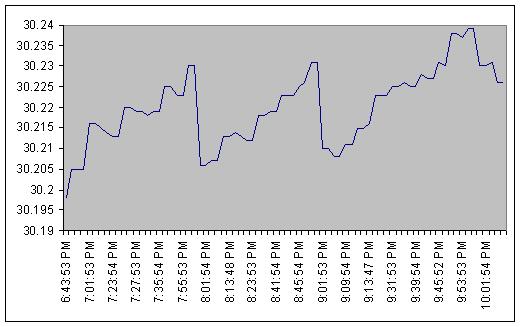
I think you might start to see a hint of it at 1000 to 1500 feet. But whether you see it also depends on whether your temperatures change quickly. In inland areas and the mountains, the most likely time for rapid temperature changes are a little after sunrise. In that case, the most likely time for seeing the barometer thing is 12 hours after that. I’m at 2545 feet, and it’s pretty easy to see in my data. I’ve attached a chart for yesterday evening. It’s not hard to see. Since the calculation is in the console, and it seems that the console’s algorithm always uses temps from the top of the hour for the 12 hour ago temperature, I don’t think it matters at all what your archive interval is. I’m guessing they aren’t getting the the temp from the regular archive data, but are using the graph memory data. Remember, the console can’t count on the data logger memory being present.
I should add a comment in Davis’ defense. The SLP formula in general (not just Davis’ implementation) is a mushy formula in my opinion. The 12 hour mean temperature input is an attempt to remove diurnal variation effects from the formula (so you don’t always have higher pressure at night and lower pressure during the day. But it’s a “let’s not try very hard” solution. Because temperature is an input at all, any rapid change in temperature will affect the resultant pressure. I bet even if you analyzed some NWS barometer data you could find this sort of thing. SLP is not a measured value. It’s an estimate to try to come up with a common denominator that allows comparison of pressures from stations at varying altitudes. Even the NWS recognizes these limitation. For example every station has a unique fudge factor (the plateau correction) based on historical data to try to bring the SLP for that station to a comparable norm and reduce annual variations. I think this is why CWOP/MADIS prefers altimeter. It’s not a mushy value. Then systems that ingest the data can compute sea level pressures using alternate methods that use something other than a simple 12 hour mean of measured surface temperatures. Here is probably even more than you wanted to know about sea level pressure: http://www.crh.noaa.gov/unr/?n=mslp
All that said, there is room for Davis to make an obvious improvement (more density for the 12 hour ago temp history).
Bill you may be the only person at an altitude that triggers this problem. Have you searched the cwop page for nearby stations to see if any of them are having the same problem? I would have to do some research to see if would be possible to search the cwop database for stations running a vp station and above 5000 ft. or see if billybob could help us find that data. Once you know the station id’s it’s easy to view the graphs looking for the dip.
If the other nearby VP stations are sending altimeter values (like they should), it wouldn’t show up in their CWOP data. But if you want to see it at another station, see my chart above, and I’m only at 2500 ft.
Update: Since it’s been 1.5 months since I communicated with Davis about the Barometer readings at higher elevation, I thought I would give them a call and see if they are going to do anything about it. I spoke to the same tech I dealt with before. I mentioned the email that Steve (tinplate) had sent Davis (and me) about 2 possible solutions. He asked me to send him Steve’s email and he would forward it to engineering along with my inquiry about a fix.
I received this reply within an hour:
"I forwarded your email along with the attached email to engineering. I got an
immediate response indicating the fix was to be added in the next firmware
release. There’s no firm release date yet, but most likely it will be
released in the next 2 to 3 months. "
I didn’t get any response after I emailed that to them. I should have followed up. Since you have a better contact than me, forward them this as well. I noticed a small error in my original email, and mailed this correction a few hours after that.
(to Davis)

Regarding my earlier email, I just realized the formula I included
calculates the 12 hour ago temperature, but I left out the current
temperature part of the mean temperature calculation. It should have been:

T11 = temperature at the top of the hour 11 hours ago
T12 = temperature at the top of the hour 12 hours ago
T = current temperature
M = current number of minutes past the hour
Tm = 12 hour mean temperature

Tm = ((((M * T11) + ((60-M) * T12))/60) + T)/2

Steve
SoftWx
I installed V1.6 firmware for the Davis VP2 last night about 6 pm. After 12 hours, the Barometer graph now looks great! No bumps or dips on the hour like before. I have an elevation of 6978 feet entered on the console. Looks like Davis has solved this prob.
Maybe…maybe not. I’m just happy they fixed it. One gets a little spoiled dealing with Brian and Steve (Softwx) where probs are fixed almost instantly, but Davis came through.