Hello,
(Sorry for my English, it is about a translator)
I am with the version 1037Q Build35.
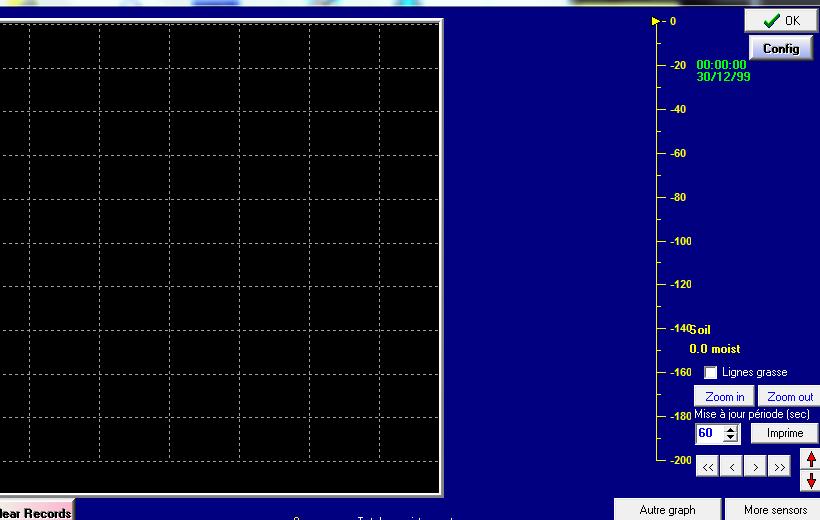
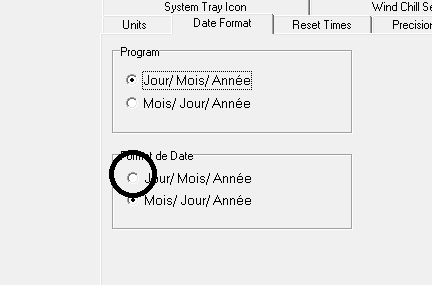
As the capture of screen indicates, I remain constantly with a date 30/12/99? I specify that the clock of my computer is correct thus the screen principal.
How to solve problem?
Thank you
Serge
I take it that this is the extra sensor real time graph?
maybe you have customised it, via the setup
but do not have set to plot anything?
Hello,
That has not remained per the same date and same hour, for two days the graphs do not appear.(
Detector height of snow et soil)
Thank you
Serge
Envoi par Email Databackup
Hello,
That does not function when the adjustment is made with Vaisala wxt520
Extra information: I have carry out tests on Vp2, and Vantage Vue that functions correctly.
I think that it there is a problem with Vaisala level of the Graph extrarealtimegraphmore and extrarealtimegraph. That does not function.
Thank you.
Serge
the WXT520 does not have any extra temperature/humidity data?
(i.e so not data to plot on the extra sensor real time graph)
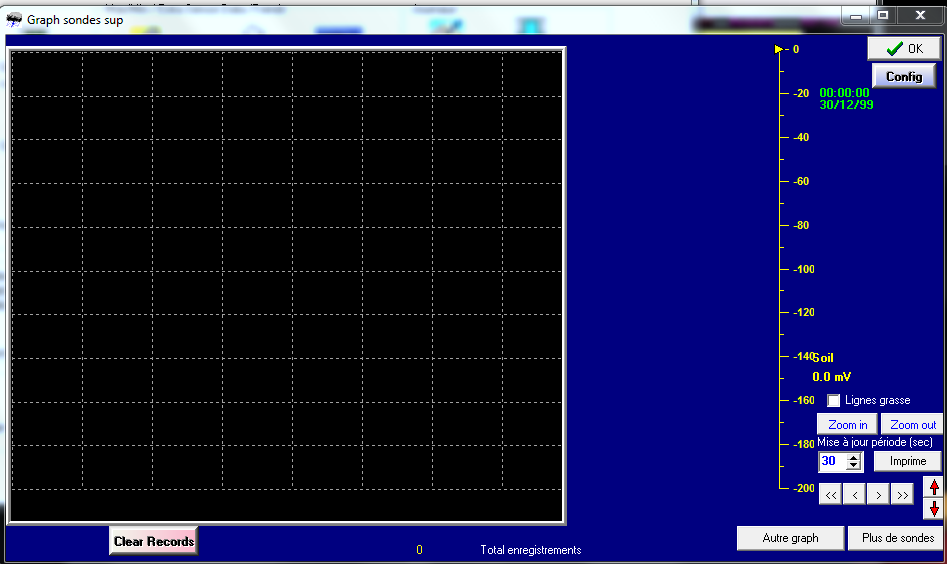
Indeed, however my detector 1-wire height of snow functions my does not give any information on the Bizarre graph?
Serge
Brian,
If I included/understood well there is nothing to make, that will not function with a Vaisala station?
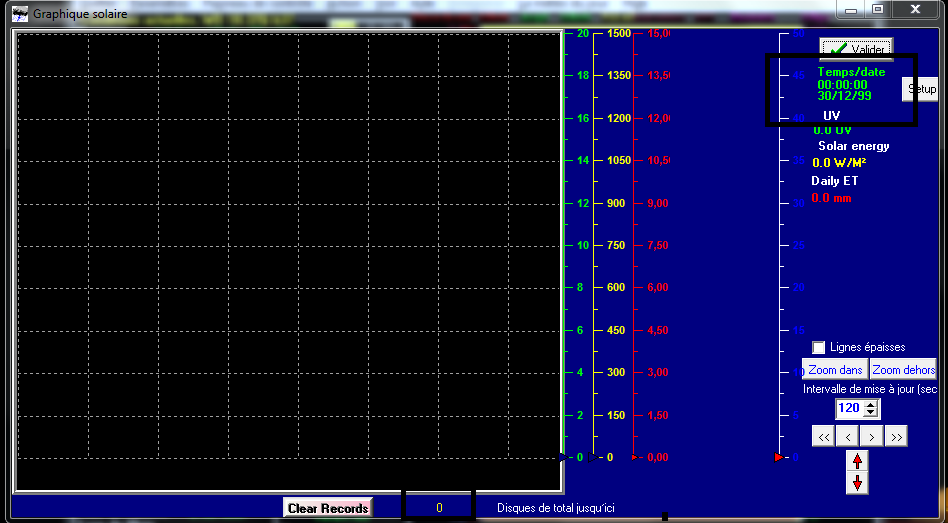
Another example: impossible to have the graph sun, hour 00: 00: 00 and always 12/30/99.
Serge
Bonjour,
the WXT520 does not have any extra temperature/humidity data? Yes
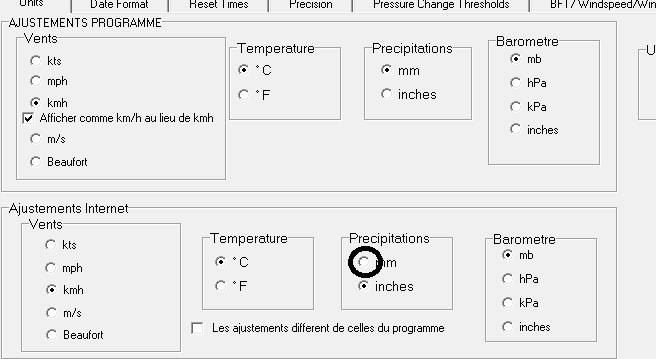
With an adjustment on a Vaisala station:
In 1-Wire (and only in 1-Wire) with a correct adjustment on level because I control the situation why? In Avanced Graphs (Custom Graph) also does not function the updates of customtext.txt are not done any more in customtextout.txt.
And I reiterate the graph does not function I remain with a date blocked at the 12/30/99.
With another station Oregon example, VP2:
That functions correctly.
I think that it there is a concern with the 1-Wire under adjustment WXT520.
I redemande my question so with a station Vaisala WXT520 can one use Custom Graph and the graph in 1-Wire: Yes/Not ?
Thank you
Serge
Hello,
I passed part of my day to include/understand the reason, with all the possibilities.
I note that my my network a 1-Wire functions correctly.
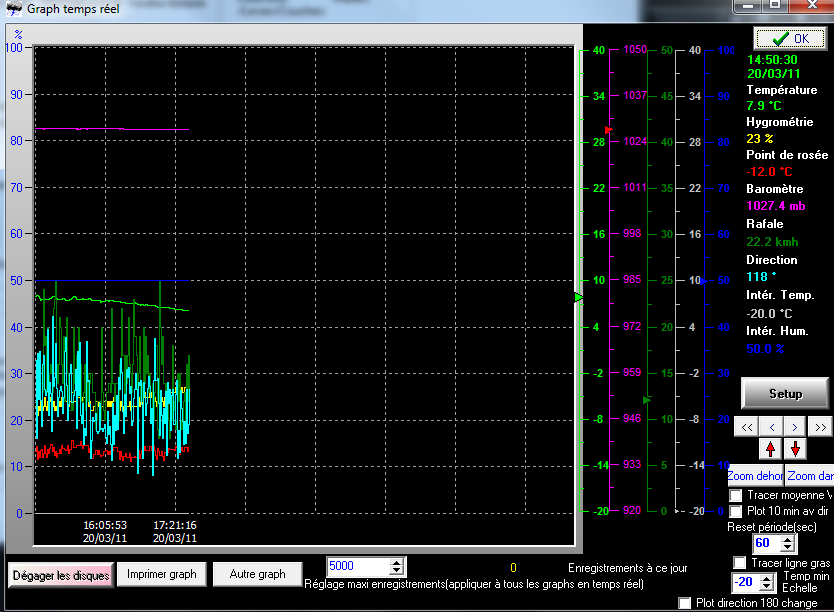
That the temperatures, moisture, ext. functions correctly on the graph.
Unfortunately that all the graph which comes from the network 1-wire does not function.
I deduce that it really problem with the 1-Wire when which I am configuration WXT520 of Vaisala.
Good day
Serge
Here the problems which I have in 1-wire like: ALITTLEweird1/Silversword
Serge
.zip and email me your settings files, and I will test/check here
Ok Brian,
Sending of the Email
Thank you
Serge
I am not able to duplicate this problem with the extra sensor real time graph or the solar real time graph
using your settings and your data
your data shows up in those graphs with the correct date and time
in my test I set some sample data to arrive from a WXT510 station
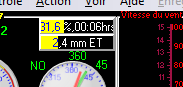
what is the barometer reading coming from your WXT510 station?
also, any errors under view, program event log?
also the problem might be related to your regional windows settings (e.g for numbers , date, time)
what is the barometer reading coming from your WXT510 station? yes
Brian,
I have just seen me that it but impossible to safeguard on that it is to surround even when I click that above is returned by defect.
Serge
I am meaning your windows regional settings for time and date format
also make sure you have WeatherD.exe set to run as administrator
do you see any errors under view, program event log?
one thing I have discovered
I had older data in my test data files
in your data back up .zipped files you sent me, there was no data files for the real time graphs
ie
graphdata.inf
graphdata2.inf
graphdata22.inf
graphdata3.inf
graphdata4.inf and graphdata5.inf (for lightning counts)
do you have those data files in your data files folder?
(and what is the create/modifed time on them?)
also, what is the barometer reading showing in WD?