WxSim Comparison Page (MySql) After Feedback.

Hi,
I must admit I am not a Weather Guru so please bear with me here.

I have spent a lot of time on WxSim over the years, testing for Tom with early days WxSim-Lite and Autolearn .etc (enjoyed every moment).

However as one who is always a bit of a visual freak when it come to analysing things, I have over time lent towards MySql to achieve that.

Before you question : Yes I totally agree, that WxSim has all the detailed and visual analysis onboard, however my problem has always been that I am not always local to my Haydes Canyon (NUK) which it runs on.

So I have always tried to display what has been happening on my Hosted Weather Site, in order to see it on my mobile phone or pc around home or when away.

In addition to that I appreciate the fact that Forecasts are made in the way of ( Todays High and Overnight Low ), this is were I differ in my MySql Comparison.
I Compare the Daily 24hr High and Low.

I admire Jim McMurry’s Comparison script, I used it for years, though I prefer to see the 24Hr detail (that’s just my opinion, right or wrong).

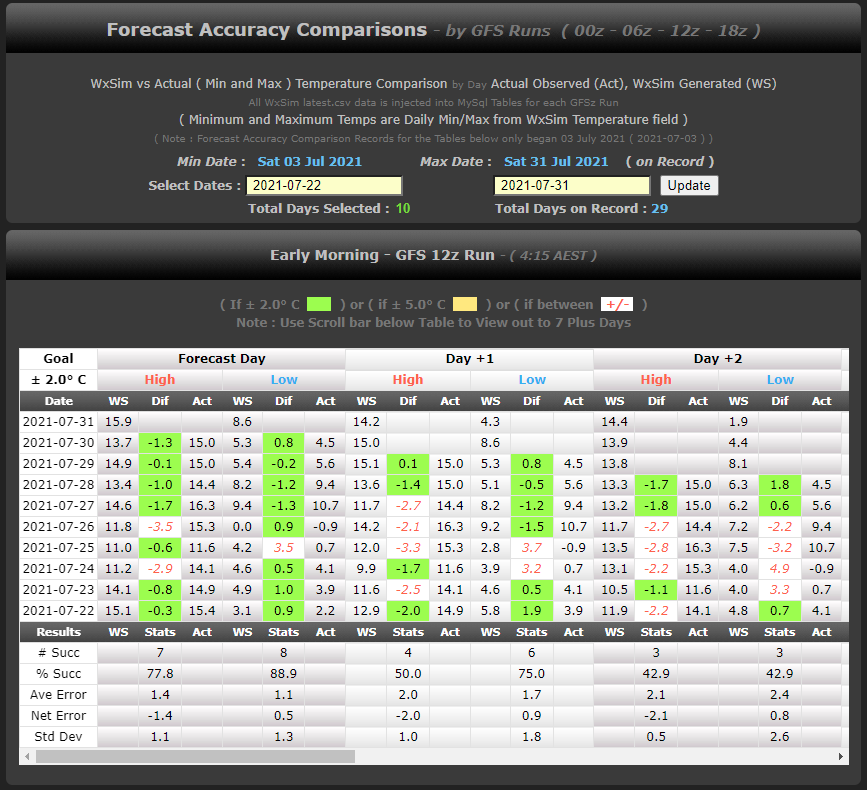
Currently my new (MySql) script does not look ahead (+days) like Jim’s, maybe in time I will achieve that, but for now I just Compare ( Only Daily 24Hr ) Yesterday vs WxSim Forecast (and also current 30Min WxSim vs 30Min Realtime Max/Avg/Min).

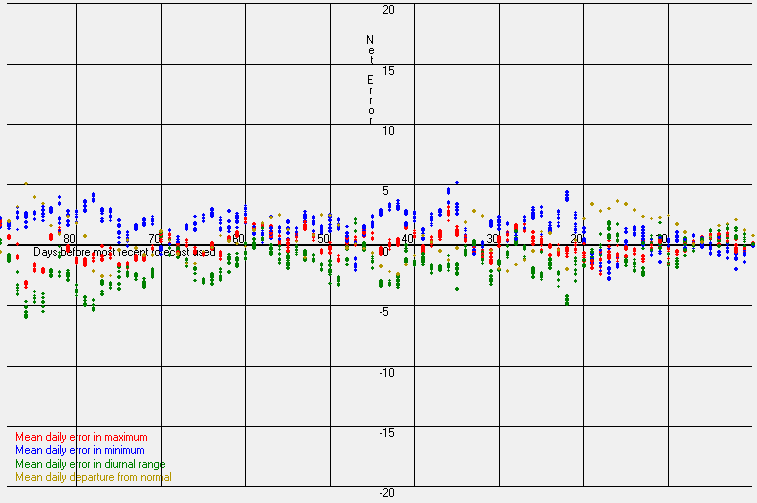
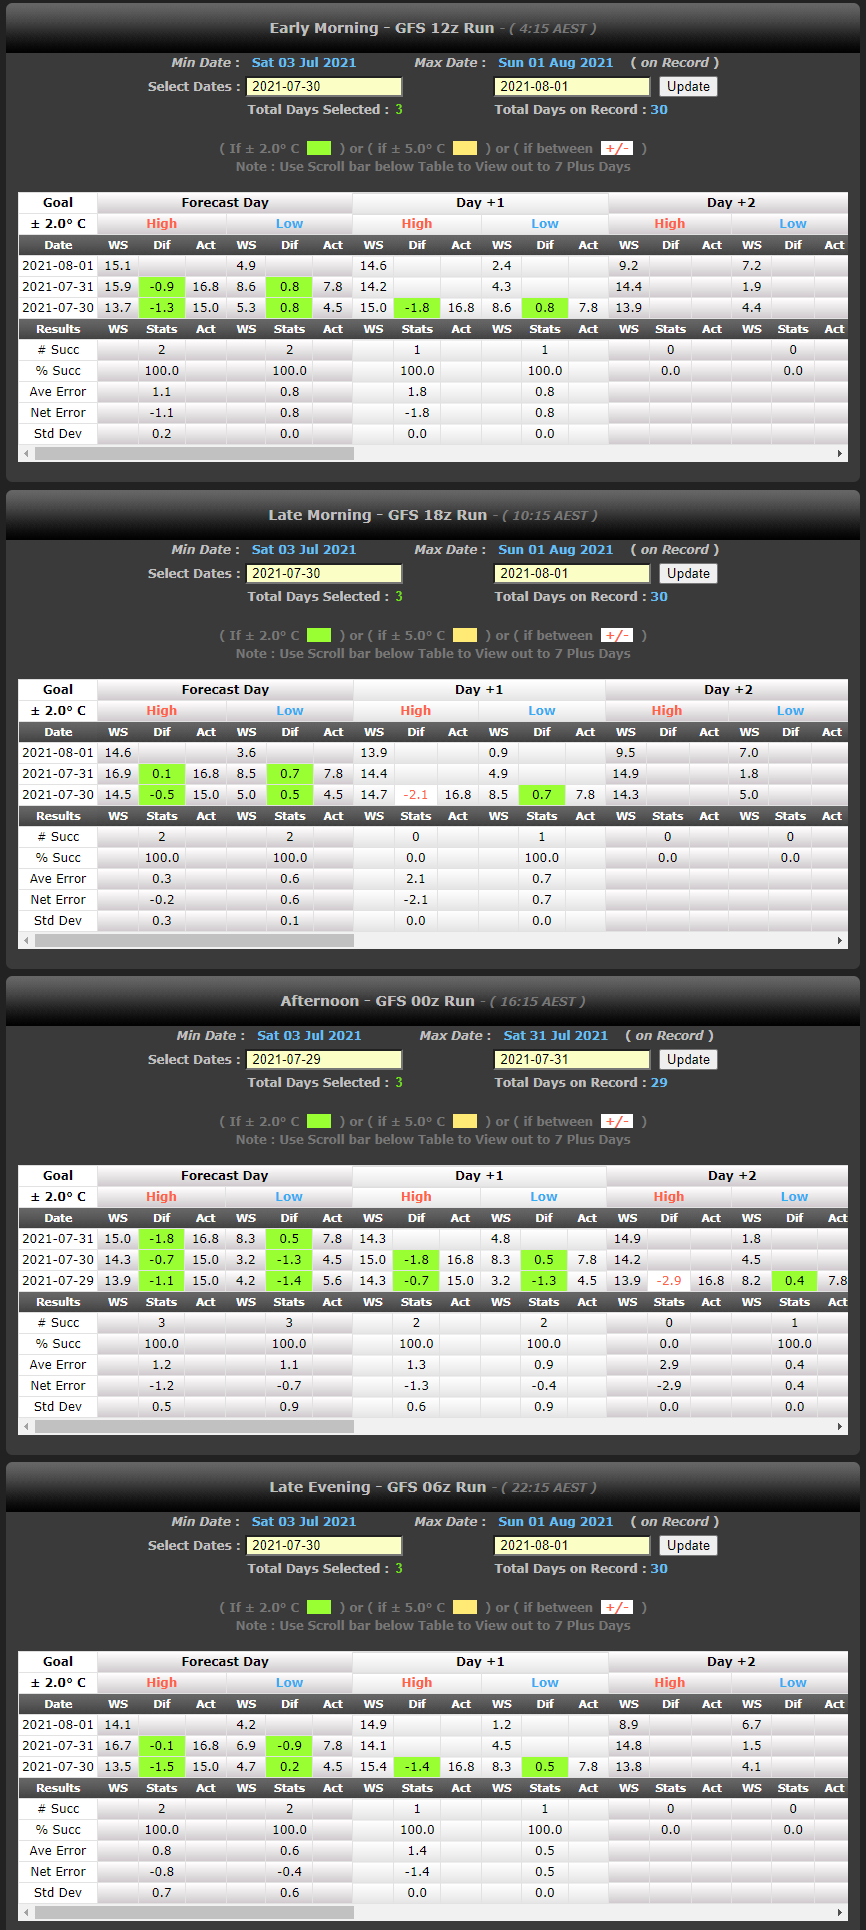
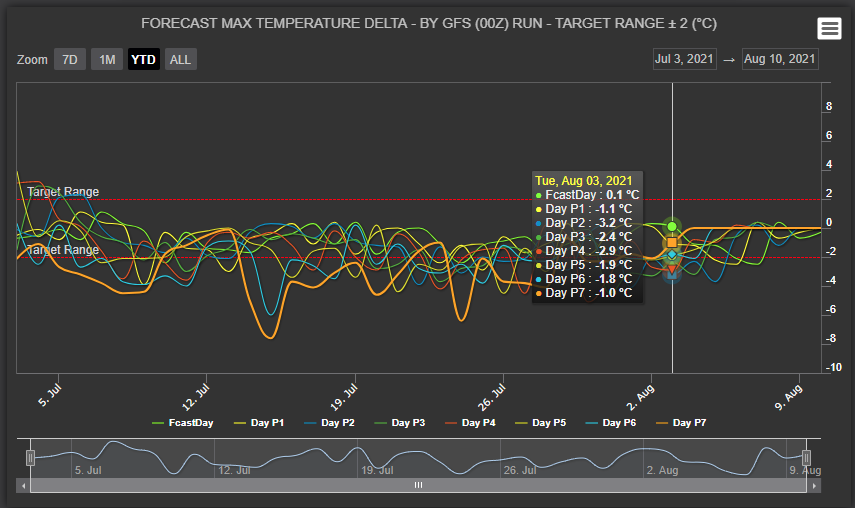
So I can see the WxSim Forecast (High/Low) vs Actual (High/Low) within the 24Hr period as well as near realtime in graph form. I also do this by each GFS Run (00z,06z,12z,18z) in order to try and display variance between them all (ie. is one better than the other). The latter statement is a big question I have going way back.

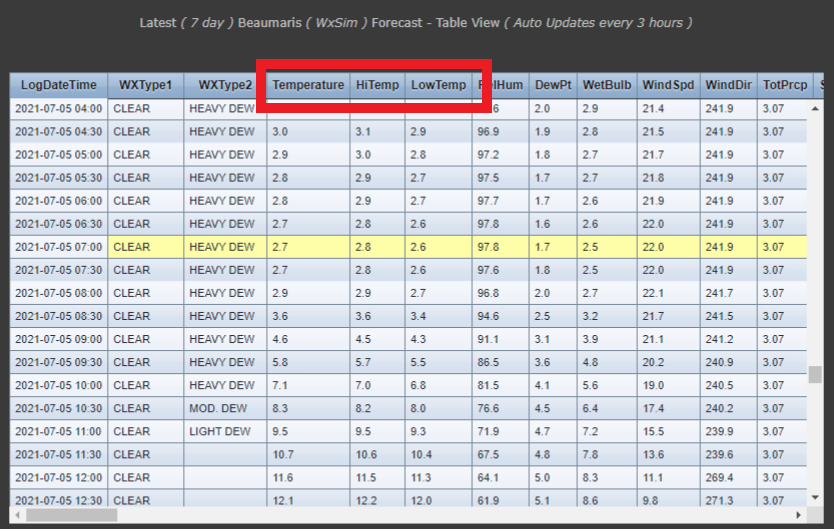
I should mention here that all my (MySql) Tables / views / Scripts .etc are fed by inserting the entire “latest.csv” file for each GFS Run (by Zulu Run) into MySql, many scripts and Cron Jobs to achieve an output. Not an easy task as Javier/Koche will testify with implementing the early version a year or more ago.

One thing I also did was to display the Comparison between WxSim’s (Hi Temp and Low Temp) fields, I found an issue with them a while back where In/Outside the range of WxSim’s main forecast “Temperature” for the same (in my case 30 Min period). Tom is aware of this and thinks he knows the cause and is investigating. So I display this Low Range and High Range Compare as well.
I have also added ability to select Start / End Dates, as well as Success % based on selected Time Period (default on page load is 10 Days), as well as new Correc.txt import to MySql to display entire MAE/and more.

The ability to have the entre “Latest.csv” in MySql, allows me to be able to Compare all elements over time as I build new queries/scripts/views.
So I am just after some feedback on the pages and how they function for you (are there any issues) what are your overall thoughts . etc
Do the page based comments explain / enough detail to understand the Tables/Graphs .etc
New Compare Page Link Here : https://beaumaris-weather.com/wxsimforecast_accuacy.php

I still have a few issues regards significant changes in forecast variation recently (tabled in other posts, still investigating reason/cause) in particular MAE.

As I write this Forecast Temp now is 11.5c actual is 17.3c , totally weird, was cool now warm, fact. (Yes Chris that’s Local not Forecast issue !).

My thoughts on the current Temp (diff now over 6.0c) issue, which is not factored (and can never be) into the forecast is the fact we have near 100% Cloud Cover and many Fires (smoke) due to Fuel Reduction post Fire Season in the local areas.

Kindest Regards Always,

Hi Tony

Your page is great and I’d love to be able to have my own equivalent someday.

Do you know the reason for the sustained uptick in MAE that occurred in one day in November 2020?

Is it correct that that the degF MAE values are based from freezing point (32F). As they are errors shouldn’t they just the degF values of the degC values, i.e. 9/5 of the degC values?

Greetings Tony

I am very grateful to your scripts related to WxSIM. When I study them a little, they seem to me to have a great complexity in their construction; I think you have a lot of merit.

Your page:

                                                   [https://beaumaris-weather.com/wxsimforecast_accuacy.php ](https://beaumaris-weather.com/wxsimforecast_accuacy.php)

also makes me envious. I admire the mastery you have in programming.

The Forecast Comparison tables look very good to me, although I have to admit that I do not understand the meaning of the Low Range and High Range values.

I also find the comparison charts very useful according to the daily hours of the forecasts.

Finally, the MAE charts are very good, with the precise information to get an idea of the progress of the forecasts. I have tried to carry the values of the correc.txt but, although the table has been created, the import of the values does not finish working.

I have spent many hours admiring that page of yours and I admit that it is a pleasure.

Saludos desde San Sebastian

Javier

Hi all,
Sorry for late response, been flat out with one thing or another…

Firstly : In response to Chris: (Thank you for the kind words) : :oops:

Do you know the reason for the sustained uptick in MAE that occurred in one day in November 2020?

Is it correct that that the degF MAE values are based from freezing point (32F). As they are errors shouldn’t they just the degF values of the degC values, i.e. 9/5 of the degC values?

Regards uptick in MAE (I have my assumptions (being changes I made to analysis range in wret, though it happened at same time there were GFS issues and WxSim version changes, as well as a Seasonal Transition period), so still unsure, however MAE is finally reducing. Oh and thanks for the heads up on degF, fixed that same day you posted it.

Secondly : In response to Javier: (Thank you for the kind words) : :oops:

The Forecast Comparison tables look very good to me, although I have to admit that I do not understand the meaning of the Low Range and High Range values.

Maybe the “Low Range and High Range values” meaning will be better understood here: http://discourse.weather-watch.com/t/69391 as Tom has fixed it, and also he is looking to fix similar issue I raised regards the Wind Gust too high in first row of lastest.csv file. Also attached image showing the output of latest.csv (highlighting the WxSim Forecast “Temperature” as well as the “HiTemp” and “LowTemp” by Row, In Plaintext WxSim may say 8 degree (though in Latest.csv detail shows the range maybe 8.5 or 7.8 etc. By doing my analysis in Mysql I was able to visualise that there was an issue with the first row in “Latest.csv”, which was displaying previous run values and Tom has now fixed that with the current version (see: post in link above), Same goes for how I found issue with Wind Gust data in same file, Tom is currently fixing that too.

Thirdly : I would like to apologise to Chris for not completing usable scripts (for him to adjust and use for others), reason being there has been so much going on with changes for one thing or another and health issues .etc. That as well as the fact I am now currently trying to emulate the original concept (being the masterful : Jim McMurry’s WxSim Compare Script) to be displayed using MySql, the current version I have achieved only Compares each WxSim GFS Run by Actual Day, I am working on same to look back against 7 Days Prior. Though still a way off sorry Chris did not meet the (Not Months away time frame).
Although I suppose I already display same (or beit in even more detail = being 30min detail) in a graphical form as seen here : https://beaumaris-weather.com/wxsimcsvmysql/realtime_graphs_wxsim_Act_WX_GFS_Runs.php. mm now pondering the question as to whether I bother displaying it in Jim’s Table Style. :-k (Though would be nice to see what each forecasted day was 7 days back vs the Actual = so I will likely continue down the path I was heading).

I have had many emails (and some posts on other Threads on this Forum) asking for a copy of the script/s (which are many). However they are mainly Weather Display users, who I have not had time to respond to, also they would require major mods to use with WD (as my scripts are purely based on CumulusMX - Outputs) and that is Time I cannot afford to spend assisting with help, nor do I have the expertise to do so, sorry.

Latest Functioning Page I have is here : https://beaumaris-weather.com/wxsimforecast_accuacy.php, Chris I will make base in the weeks ahead. :smiley:

Note: due to all the external issues going on with data etc. Back in March I set my WxSim-Lite Mix percent to 46% and have left it there in order to hopefully stabilise. After many years of playing with the mix at my old location (South Franklin Weather) I found a sweet spot with 46%, so thought I would try it here.
Note: also attached latest “errdatelatest” image showing better results recently.

Kindest Regards,

Tony


H Tony

No worries about the time taken to get things sorted out. Life often finds ways to get in the way of our best plans!

For other WD users wanting to use Tony’s scripts the ‘plan’ is that Tony is going to ‘tidy up’ the scripts and then let me loose on them. ‘Plan’ is a grand word for a discussion we’ve had so please don’t assume it’s a fully defined project plan with resources assigned and a lead time that’s +/- a couple of days. The scripts will be available when both Tony and I find time to do the work that’s needed to modify/release them.

I’m hoping that the only significant change to be made is to adjust the import scripts to read data from WD rather than Cumulus. Once the scripts are modified and tested they will be released for WD users to download and install for themselves. I’ll be providing instructions on how to install them and if appropriate provide an installation script to help get things set up correctly.

Hi Chris,

Just an update on the WXSIM Compare to Actuals (+days).

Currently my new (MySql) script does not look ahead (+days) like Jim's, maybe in time I will achieve that,

First pass very rough output (not yet final or formatting applied) which when done will display trimmed down headers as per original Compare Script and color highlighting for Deltas.

Here is current rough example of 12z and 18z and 002z and 06z, as mentioned before, this does not use plaintext.txt or AM/PM High’s/Low’s, it uses latest.csv by GFS Run and by Day (24hr) (Forcast vs Actual) High’s/Low’s.

Example : https://beaumaris-weather.com/wxsim_forecast_compare_table_12180006z.php

Getting there slowly, Wife’s birthday tomorrow and have to pickup her new car Tuesday, so progress will be stalled for a bit.

Kind Regards,
Tony

It’s looking good even as a rough example!

Hi Chris,

Formatting applied in this latest Test version : [https://beaumaris-weather.com/wxsimforecast_accuacyP7Stats.php) , Thoughts ?

As with Jim’s original version there was always bound to be screen width issues, I mainly use my Saratoga Template (which is set to narrow) so elected to use a scroll div (not all will like it though for now it’s what I have). I will eventually display all this data in charts which will omit that issue.

Now working on the Success Table which will reside below the current table on this example page (also scrollable with the current table).

On a side note, not happy about the big weather swings lately. My MAE is climbing again, though envisage it will drop as these fronts/lows pass.

Kind Regards,
Tony

1 Like

I’ll have to look later when I can look at it on a bigger screen. It’s definitely not something to view on a phone screen, especially not when I need a visit to the opticians for new glasses!

Hi Chris,

So here’s the latest update : https://beaumaris-weather.com/wxsimforecast_accuacyP7Stats.php.

After a lot of coding with PHP/MySql/JS/CSS and Tables/Views etc. the latest version now includes the Stats, if someone could cast an eye over the Success/Percent/Error/Std Dev outputs, it would be greatly appreciated.

I’m confident I have them correct, though after so much coding I am open to any validation errors I may have overlooked.

Use the Calendar Popups near top of page to change the date ranges as desired,it will adjust all GFS zulu run Tables below.

Kind Regards,
Tony


Hi Chris,

Another Example : Added Calendar Date Selection for each GFS Run, so user can just select a date range per Run vs the original was one date range for all Runs.

One Date Selection : https://beaumaris-weather.com/wxsimforecast_accuacyP7Stats.php
All Dates Selection : https://beaumaris-weather.com/wxsimforecast_accuacyP7Stats0.php

Kind Regards,
Tony


Hi Chris,

Not every ones cup of tea I envisage, though if you understand the p1 to P7 day Tables, it will hopefully make sense.

So Basically the afore posted compare tables in Chart form :

Max Temp : https://beaumaris-weather.com/historicWxSimMaxDeltaDailybyGFSRunP7_SA_inc.php

Min Temp : https://beaumaris-weather.com/historicWxSimMinDeltaDailybyGFSRunP7_SA_inc.php

Kind Regards,
Tony


Hi made some mods to my MySql Comparison Tables, hopefully they load a tiny bit quicker for users.
More info here : https://beaumaris-weather.com/wxnewspost.php?id=9
Updated : Tuesday 16May-2023 @ 11:20 AEST : More Mods done to speed up queries and page load times, hope it works for other users.
Kindest Regards,
Tony

Further Updates have been done to hopefully make the MySql Queries run faster and display better and also modified the Menus in order to hopefully be a tad more easier to navigate.

https://beaumaris-weather.com/wxnewspost.php?id=9

UPDATED : Final Mods Complete, all should now be super quick.

Kind Regards,
Tony