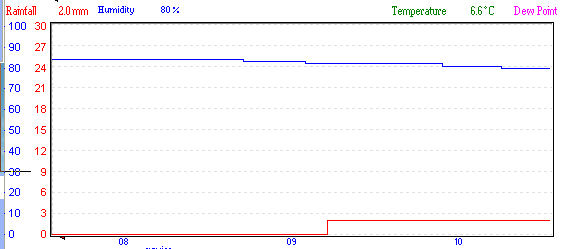
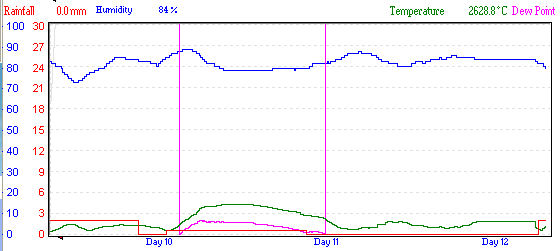
When the graph is in autoupdate mode, the temperatures are out of scale, and telling that we have 2628 centigrade, which is rather hot, when shifting to eg. 72 hours view, the temperatures are shown correctly, except for some minor glitches.
hi
try:
go to setup, graph setup, then click on lift/lower the temperature line…so that it lifts the temperature (and dew point lines) up, so that the oversscale problem does not occur again
i will see in a future version about getting wd to auto check for the lowest dew point reading to plot on the graph, to fix this issue
You now have a customer, I will purchase your very good software.
One question about the WS2310, last week we did have a quite powerfull storm here, windspeeds in blows up to 40m/s, but the WS2310 states either — or 7-10 m/s, is this because of some limit, or can it not catch the hard windblows, and only measure an average?
hi
i tested a ws2310 with a compressor up to 85 knots OK
but, note, to avoid the OVR and wind spikes, you need to replace the cable between the anenometer and the temp/hum sensor with twisted pair shielded cable, or at least twist many times the existing cable
also, wd starts again at 0 for winds above 50 knots (or what that converts to in the units you are using) (as I could not find any flag in the data (it must be there somewhere), but, you can set a toggle, under setup, general/misc, to add the 50 to that number, so that it carrys on from 50…