My graph history plots are all fine except for one thing, the Wind Direction plotting is way off. It never shows anything from 180 to 360 degrees. It plots everything between 0 and 180.
The plotting on the main screen graph is fine, it plots a full 360 degrees.
Which file are you referring to that shows this problem? When I go to your site I get WDL or MML so not sure which file this pertains to exactly. Let me know and I will check mine to see if I have the same problem.
Hi Dan,
This is just in your WD program, not WDL. I am speaking about the “Graph History” button from the “View” menu in WD.
I have checked my historical data, and it is all correct, showing many wind direction entries between 180 and 360 degrees, but the wind direction plot in Graph History is not plotting those points.
I guess I could try a screen capture and post it here, but I just wanted to see if others are having the same problem.
Dan,
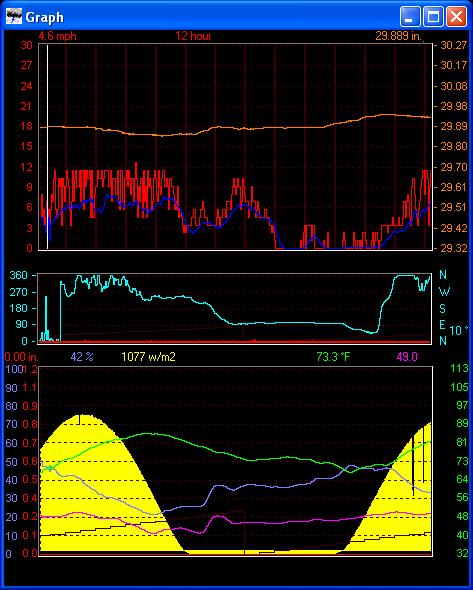
That is the wrong graph. You are looking at the “Real time” graph. I am talking about the “graph history” graph. I am having all sorts of problems with it.
Notice the wind direction field (field #12), then compare to the graph at that time (it’s the peak gusts of the day).
There is no wind direction plots for those points, it is plotting the wind direction between 0 and 180 all day long.
Tom,
Check and see if you have the “plot 10 min. average” in your setup for the graphs, but I don’t think that WD plots every single point in the 24h graph.
Peter
i just checked mine and its OK, but it looks like its just the NWSE is around the wrong way for you
which version of WD is this with?
have you tried 10.35n?
if you could zip and email me your data file month82006.inf and month82006direction3.inf
and your settings file wdisplay.ini, i will test here
Brian,
I installed a second copy of WD with the 2wd.txt file so I could attempt a debug of the graphing problem.
It appears that I have some missing data in July’s 72006lg.txt file, due to my weather station being down for 4 days because my VP ISS board was struck by lightning…Davis traded me a good one for mine.
Anyway, in the 2nd copy of WD I loaded datafiles and logfiles from 2004, 2005 and up to June 2006. No problem with graphs.
When I load the 72006lg.txt file though, it goes bad. Every month now has the wind direction incorrect.
Does missing days of data affect past data in those Graphs?
I am going to attempt to put in bogus data to fill all the days of the month in July to see if it works.
If you would like, I could send you the 72006lg.txt file.
By the way, I have been using version 10.35n.
Also, I noticed a bug in your MYYYYlg.txt logfiles. Since February 2006 the very last entry in each month’s file has a date of the First of the Month at midnight, but the data is actually from the first of the next month at midnight…example:
28 2 2006 23 57 62.0 74 53.6 30.085 0 0 164 0.000 0.000 3.010 3.650 62.0
28 2 2006 23 58 61.9 74 53.5 30.085 0 0 164 0.000 0.000 3.010 3.650 61.9
28 2 2006 23 59 61.8 74 53.4 30.085 0 0 164 0.000 0.000 3.010 3.650 61.8
1 2 2006 0 0 61.8 74 53.4 30.085 0 0 164 0.000 0.000 0.000 3.650 61.8 <---- final entry in 22006lg.txt
Also, I noticed a bug in your MYYYYlg.txt logfiles.
I noticed the same thing while looking through July’s data to try to debug why my clientrawdaily files for WDL have scrambled data for the 31-day charts. I’m going to try manually editing the files to see if this fixes anything.
The Feb. 2006 files are the first ones to include midnight data at all. Previous monthly log files started at 0:01 on the first and went through 23:59 on the last day of the month. Data records from the stroke of midnight on the first of the month were not logged.
Hi
the wind direction is a separate data file, e.g month72006direction3.inf
when you do the convert log files to graphs, it is updated from the data
but note that if your logfiles have any problems, then that will cause problems
use the new data integrity checker for the logfile under view,averages/extreme, correct the data, then use the check data alignment
then scroll down and check for if and where the day/month/year goes out of sync…and where it does, note the previous good time/date, and check there in the logfile, fix, save and re do the conversion
note the the logfile (text based) is not used for WD’s data directly now much (i just need to convert a few routines over to use the data (.inf) files still (just some custom tags…days above/below temperature ones (i will do that soon))
but its a good way of checking your data, fixing/editing, and converting to the data files…
that extra data being the first data in the new month will not worry the datafile…
Thank you Brian, I have now corrected the wind direction, as I did not have the monthMMYYYYdirection3.inf
copied into the datafiles directory from my backup. Once I did that, and then reconverted July’s corrected logfile, all is fine.
The only problem that remains with those Graph History graphs is that I still cannot get “Heat Index” or “Windchill” to display the actual numerical values above the graph…the values are graphed properly, but the “Heat Index” words only change to the word “Heat” when moused over the graph.
The only problem that remains with those Graph History graphs is that I still cannot get "Heat Index" or "Windchill" to display the actual numerical values above the graph...the values are graphed properly, but the "Heat Index" words only change to the word "Heat" when moused over the graph.
i have fixed this now:
use this zip update
http://www.weather-display.com/downloadfiles/WeatherD.zip