The file gauges.js indicates imgPathURL should be changed to the relative path for the’Trend’ graph images. I can’t find them on my server and I’m not even sure I have WD set to create and/or upload them. Is there a standard location where these are created/uploaded from WD?
I’m sorry that I can’t help you with ‘Trend’ graph images, but I use wxgraphs with WD (https://swanston.maui.co.uk/gauges.htm) if that is any help.
What is the path (imgPathURL) in your gauges.js file?
imgPathURL : './wxgraphs/',
But I never understood if ‘Trend’ graphs were the same as wxgraphs, I just changed the URL :?
I don’t have a wxgraphs folder in my WD directory structure. Maybe I was supposed to manually set this up in WD but failed to do so when I added the steel gauges. I guess the graphs aren’t being generated by my system and I haven’t figured out how to do so.
No, the graphs are not generated by WD or by SS Gauges. If you go to the link I gave you, wxgraphs, you can download the .zip package and follow the Readme.txt to install.
The graphs get their WD data from clientrawextra.txt, which you are probably uploading already.
Oh, sorry, I misunderstood. I’ve downloaded the .zip file and I’ll work through the readme.txt file when I get some time. Thanks for your answers.
I think I made some progress. I unzipped the wxgraphs.zip file, edited the graphsconf.php file, downloaded JPGraph 4.2.10 and then uploaded the wxgraphs directory and jpgraph-4.2.10 directory to my server. When I open the html file (http://willowsfordfarmweather.org/wxgraphs/wxgraphs_test.html) it returns an error: font file “/usr/share/fonts/truetype/arialbd.ttf” is not readable or does not exist. On my server, the path to the fonts is: “jpgraph-4.2.10/src/fonts” and there are only two fonts styles in the fonts folder: DejaVuSans and FFFONT. Thoughts?
I’m trying to remember. . . I got them working first with FFFONT, but then I think I uploaded the Arial font family from Windows - see http://discourse.weather-watch.com/p/533782.
I uploaded my Windows Arial fonts to the “jpgraph-4.2.10/src/fonts” folder on my server and the graphs displayed properly. I almost tried that but I thought that it couldn’t be that simple!
If I did it, it must be simple - believe me ![]()
Now you need to edit lines 232-49 of gauges.js to choose which graph you display on which dial. . . and check out lines 251-3, which tell you how to alter the css to get the graphs looking better.
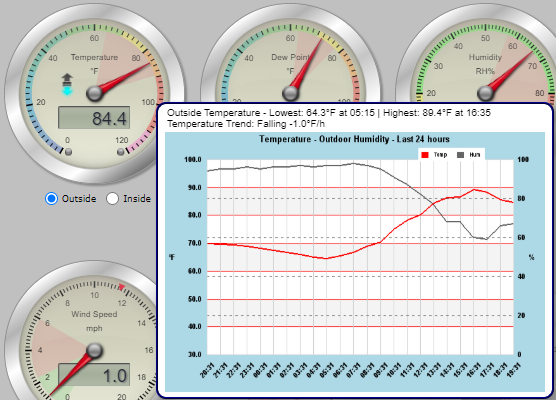
I’ve made great progress thanks to your help (see attached screen capture).
I was able to change the chart size per the CSS. Now I have to work on the chart font sizes, line widths, colours, etc. so they will look better than the default.
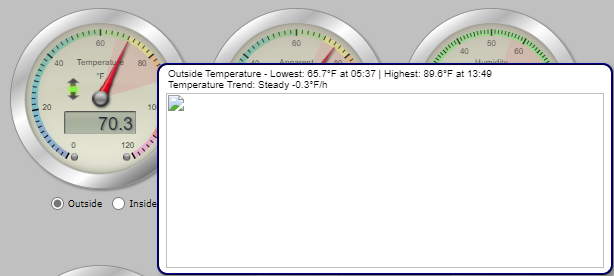
![]()
Is there an indoor humidity php file available?
No, because clientrawextra.txt does not have hourly indoor hum values. . . ![]()
BTW, I don’t know if you have noticed that you don’t get max-min indoor temp values on the indoor temp pop-up - but you do get max/min indoor hum. The max-min indoor temp values were added in version 2.7.1 of the SS Gauges. . .
Your wxgraphs are looking good, but Stuart seems to have changed the graph aspect ratio between my version (V3.0) and yours (V3.1): yours now look a little squashed L-R, compared to the test page? I may have given you bad advice, there. . . but you can always play with the width in css and see what happens ![]()
And I found my 24-hr x-axis a bit cluttered when labelled every hour, so I changed my line 47 in graphsconf.php to label them every 2 hours. (I don’t know if this causes problems with other graph types. . .)
Bummer about clientrawextra not having the indoor values. I was looking at the clientrawextra.txt file and associated .php files that create the graphs to try to figure out where the data is coming from but clientrawextra.txt is just a string of numbers, so I didn’t pursue it.
I never noticed the issue with the max-min indoor temp on the gauge. I just downloaded V 2.7.3 and will update my older version.
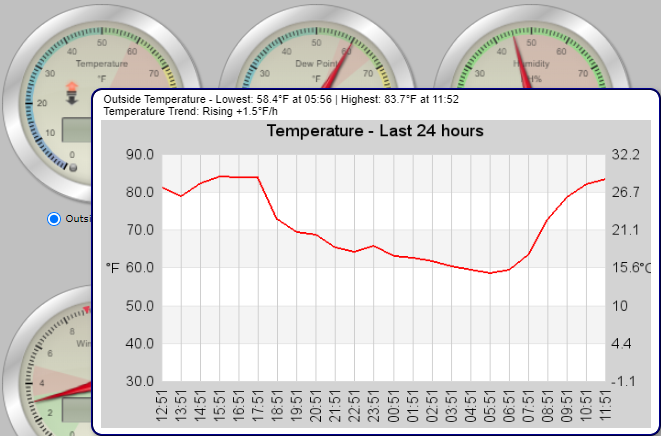
I was messing around with the aspect ratio but got sidetracked when playing with the line colours, widths, font size, etc. and forgot to go back and fix the aspect ratio. I made it 16:9, like a widescreen TV just for fun (see attached). No bad advice from you - you’ve been more than helpful.
I haven’t tested the 2-hour interval yet. I was going to but that’s also when I got sidetracked playing with the other options. I think the hourly looks okay though.
If you enter your url here or here you can see what all the fields contain.
I never noticed the issue with the max-min indoor temp on the gauge. I just downloaded V 2.7.3 and will update my older version.
![]()
I was messing around with the aspect ratio but got sidetracked when playing with the line colours, widths, font size, etc. and forgot to go back and fix the aspect ratio. I made it 16:9, like a widescreen TV just for fun (see attached). No bad advice from you - you've been more than helpful.I haven’t tested the 2-hour interval yet. I was going to but that’s also when I got sidetracked playing with the other options. I think the hourly looks okay though.
All looking good ![]()
BTW, I think I can now clear up our confusion about ‘Trend’ images. If you look at gauges.js lines 200 plus it seems that different weather programs produce different trend images, but usually in .png or .jpg format. We edited lines 231-54 to use wxgraphs with WD (specified by entering 1 in line 37) and then the individual graphs are specified by different .php scripts.
So, its only 5 years later, but i finally decided to configure the graph popups in my Steel Series. Finding this thread allowed me to figure it out.
Belated, but thanks guys.
Jim
1 Like
I dunno what it is with you and degree symbols (e.g. cloudbase graphic) but your temp graph axes don’t show them either ![]()
It’s nice to know that my ignorance and lack of experience led to someone else having success! Live and learn - I was able to add solar radiation and UV gauges on my own as I added the sensors over the years! Clayton, NC Weather - Gauges