SO I am trying to graph my solar and UV in Weather display. Solar works fine but I can not get UV to graph. I am not sure where the UV gets it’s info. Looking at the graph tab there is a checkbox at extra sensor 4. It shows nothing. I assume I need to select a sensor number but I can not find which one I need to select.
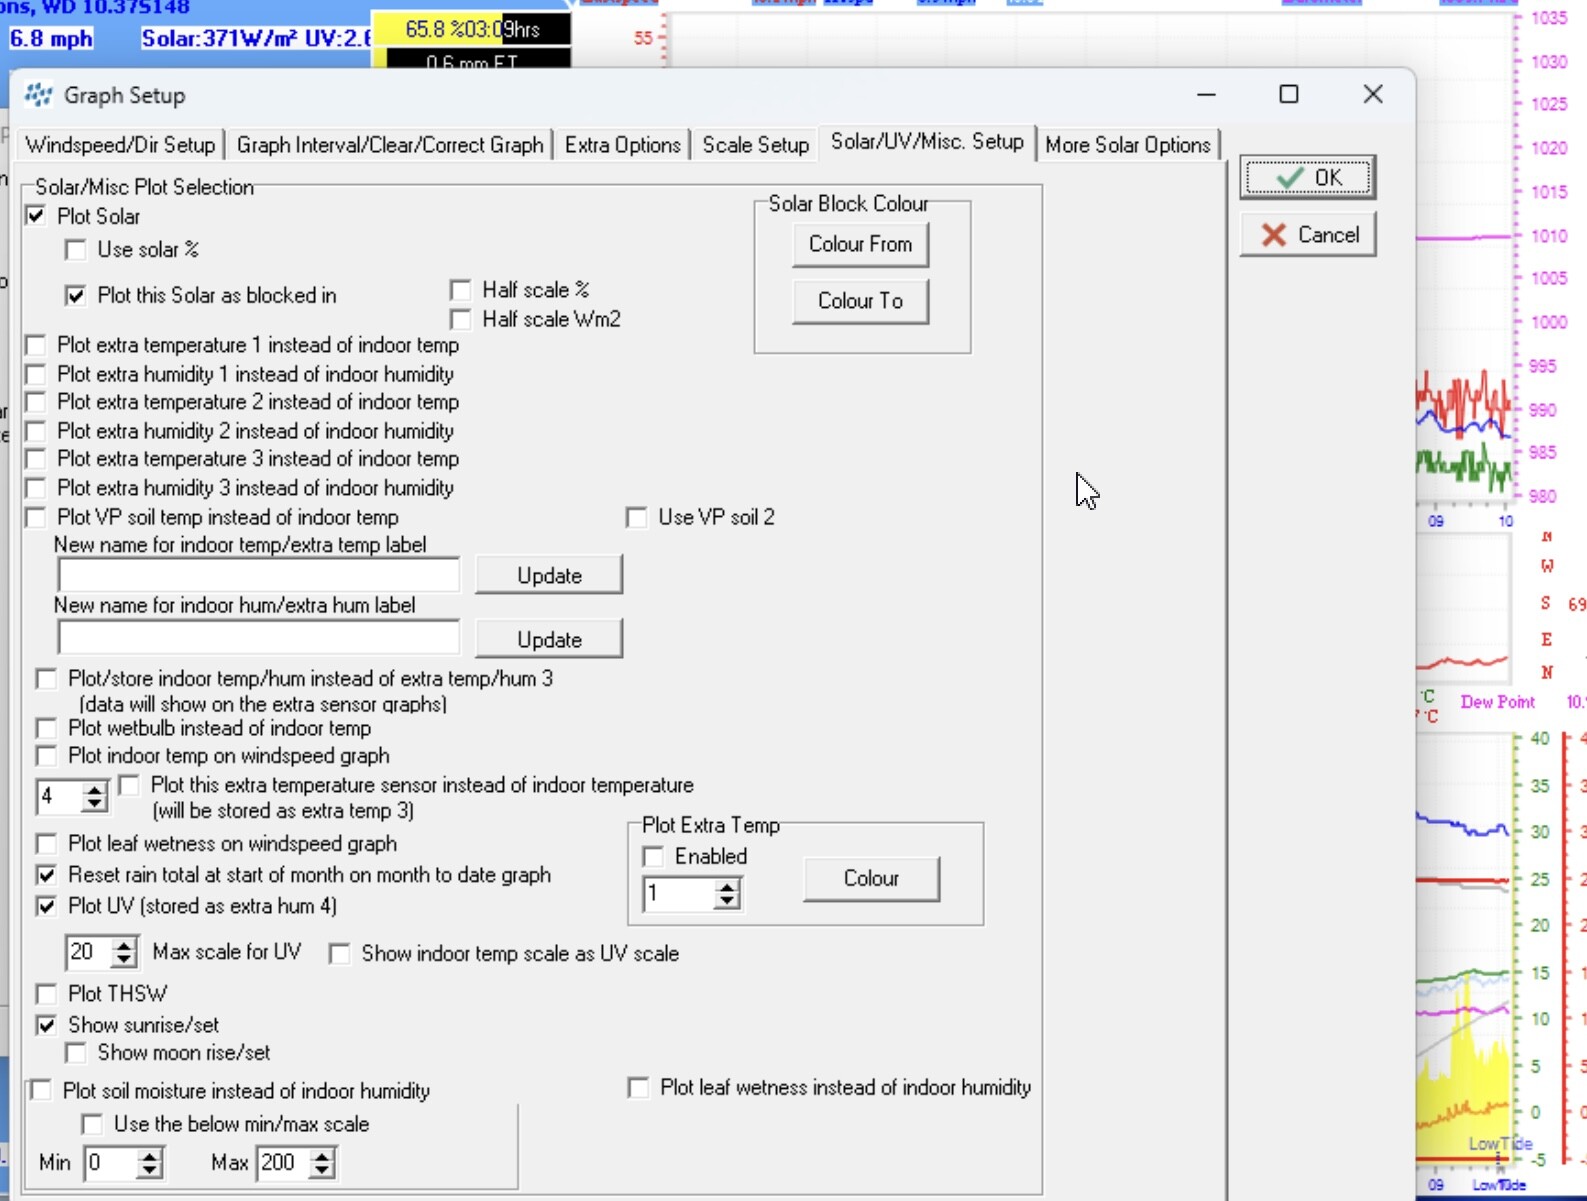
AFAIK you just go Control Panel > Graph Setup > Solar/UV/Misc. Setup and check “Plot UV (stored as extra hum 4)” and choose the Max scale. You don’t have to enter any sensor number.
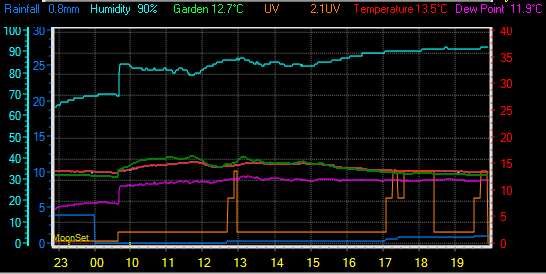
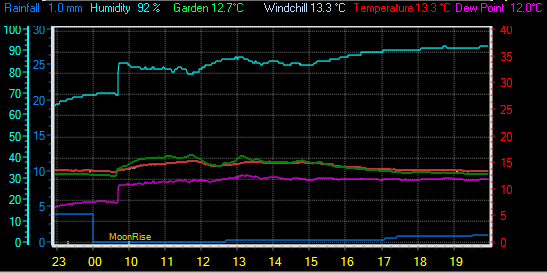
Note that graphing UV means that the Windchill label isn’t shown. . .
So I have beat myself to death still no joy something is mis-configured for sure. I not only do not get any graph info but I get weird results in many reports.
Here is some info from both my weather display web page but also from testtags.php. Maybe this will give someone some idea.:
7/23 8:55 reading
Current Solar 0 W/m²
Maximum solar (since midnight) 381 W/m² Maximum UV (since midnight) 0.0
Current 00:00 hours of sunshine today, current sky: Night time/Humid/A few clouds
Sunshine hours for the year: 00:00 hrs Sunshine hours for the month: 00:00 hrs
Current evapotranspiration 0.03 inches per day. Yesterday’s reading 0.09
7/23 10:10 reading
Current Solar 0 W/m²
Maximum solar (since midnight) 482 W/m² Maximum UV (since midnight) 0.0
Current 00:00 hours of sunshine today, current sky: Night time/Humid/A few clouds
Sunshine hours for the year: 00:00 hrs Sunshine hours for the month: 00:00 hrs
Current evapotranspiration 0.02 inches per day. Yesterday’s reading 0.09
Testtags uv data
// Sunshine/Solar/ET
// =================
$VPsolar = ‘72’; // Solar energy number (W/M2)
$VPuv = ‘0.0’; // UV number
$highsolar = ‘482’; // Daily high solar (for Davis VP and Grow stations)
$highuv = ‘0.0’; // Daily high UV (for Davis VP stations)
$currentsolarpercent = ‘0 %’; // Current solar percent for stations with a temperature solar sensor (like the dallas 1 wire)
$highsolartime = ‘9:21 AM’; // Time that the daily high solar occured
$lowsolartime = ‘12:00 AM’; // Time that the daily low solar occured
$highuvtime = ‘12:00 AM’; // Time that the daily high UV occured
$lowuvtime = ‘12:00 AM’; // Time that the daily low UV occured
$highuvyest = ‘5.9’; // Yesterday’s high UV
$highuvyesttime = ‘3:03 PM’; // Time of yesterday’s high UV
$burntime = ‘720’; // Time (minutes) to burn (normal skin) at the current UV rate, from the Davis VP with UV sensor
//
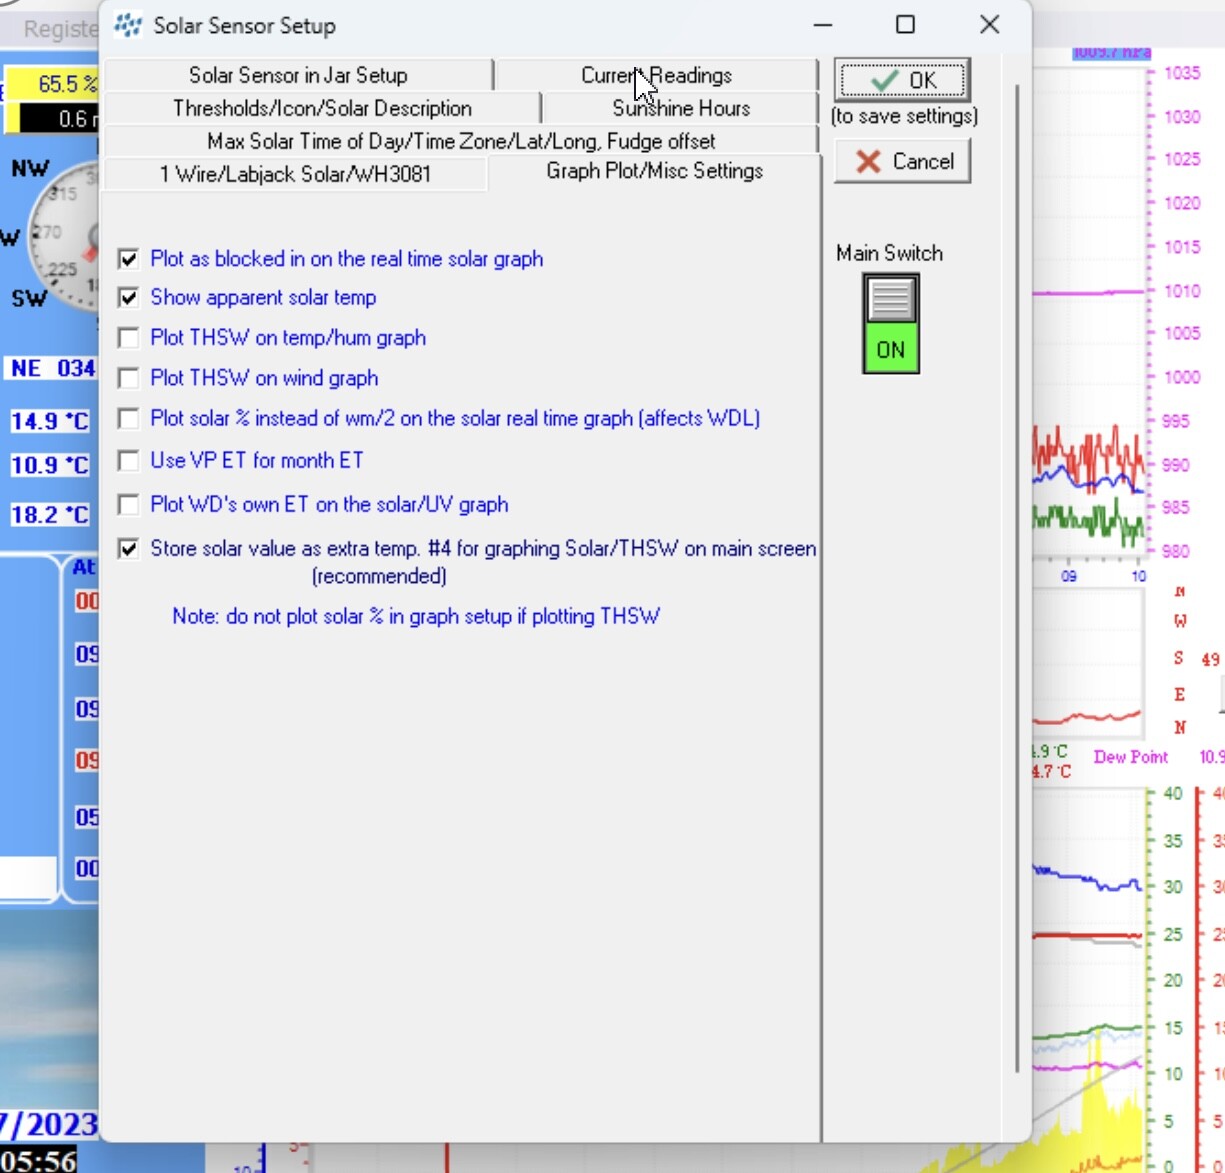
// the solar setup.
7/23 10:10 reading
Current Solar 0 W/m²
Maximum solar (since midnight) 1034 W/m² Maximum UV (since midnight) 0.0
Current 00:00 hours of sunshine today, current sky: Night time/Dry/A few clouds
Sunshine hours for the year: 00:00 hrs Sunshine hours for the month: 00:00 hrs
Current evapotranspiration 0.06 inches per day. Yesterday’s reading 0.09
Testtags uv data
//
// Sunshine/Solar/ET
// =================
$VPsolar = ‘1016’; // Solar energy number (W/M2)
$VPuv = ‘0.0’; // UV number
$highsolar = ‘1034’; // Daily high solar (for Davis VP and Grow stations)
$highuv = ‘0.0’; // Daily high UV (for Davis VP stations)
$currentsolarpercent = ‘0 %’; // Current solar percent for stations with a temperature solar sensor (like the dallas 1 wire)
$highsolartime = ‘1:33 PM’; // Time that the daily high solar occured
$lowsolartime = ‘12:00 AM’; // Time that the daily low solar occured
$highuvtime = ‘12:00 AM’; // Time that the daily high UV occured
$lowuvtime = ‘12:00 AM’; // Time that the daily low UV occured
$highuvyest = ‘5.9’; // Yesterday’s high UV
$highuvyesttime = ‘3:03 PM’; // Time of yesterday’s high UV
$burntime = ‘720’; // Time (minutes) to burn (normal skin) at the current UV rate, from the Davis VP with UV sensor
//
Thanks for the Help
Leslie Earl
I forgot to mention I can see data on my console and I actually loaded Weather link on another PC and hooked it to my console. The PC I run Weather-Display on gets it’s data from a Davis Weather Envoy.
Thanks Leslie Earl
1 Like
I’m sorry, but I know nothing about Davis/Envoy/Weather Link, just a bit about WD.
If no-one else chips in you may have to e-mail the author direct.
![]()