Hi. Morty from Australia. I have just brought a Davis VP2 with Data logger & WD. In the graphs all I want to do is to read what is going on today, week, or month etc. At the moment there are several lines, so how do I tell what each line represents? Is there a tutorial to give a lesson on how to work WD? Kind regards Morty.
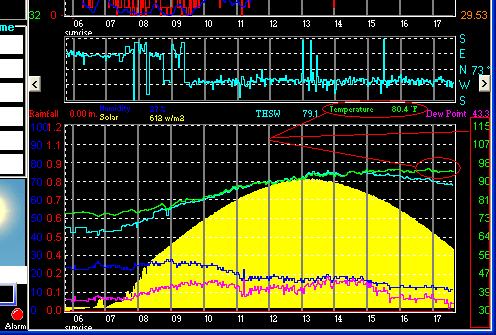
Look at the color of the line in question, then look above the graph for the same color word -
ie: green line in graph - look above graph and the word “temperature” is green.
Look in the FAQ section for some great info.
For just starting out, try this one -
Good job with the screen shot Dan -
Since I now have WD on a separate computer, it takes me a couple more steps to get a screen shot up -
I have to find myself a better work flow for bringing an image from the WD machine to mine without so many steps!
What we need is an area where we could put all these screen shots, then just reference them in the post…
I use an OS928N wireless station linked through to WD on my PC.
I have a simple screenshot showing just one event today.
I had two very brief rain flurries this afternoon which were hardly detectable unless you have a wide parting .
There were two spikes on the graph for RHumidity and Dew point which coincided with these flurries.
No rain was recorded. On the screenshot you will see the magenta line for Dew Pt.