If I go to View → Avg/Ext → and I click on every month in 2007 and write down the avg temp for just the first of each month, I get:
01 - 47
02 - 50
03 - 49
04 - 68
05 - 78
06 - 86
07 - 93
08 - 85
09 - 96
10 - 81
All BTW in
If I go to View → Avg/Ext → and I click on every month in 2007 and write down the avg temp for just the first of each month, I get:
01 - 47
02 - 50
03 - 49
04 - 68
05 - 78
06 - 86
07 - 93
08 - 85
09 - 96
10 - 81
All BTW in
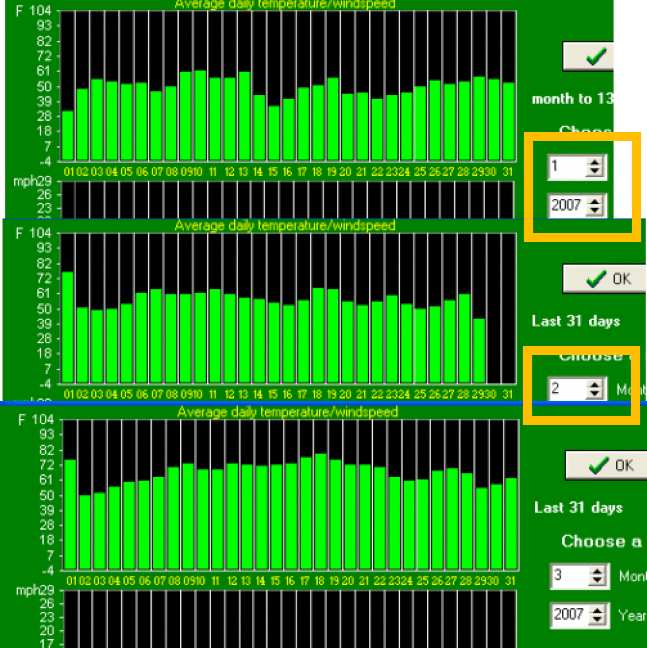
is it just the first day that is the probematic?
Well just looking at the first three months…
Which I can compare with my NOAA reports online:
http://www.tnetweather.com/parse_noaa_date.php?date=200701
http://www.tnetweather.com/parse_noaa_date.php?date=200702
http://www.tnetweather.com/parse_noaa_date.php?date=200703
You tell me, do the charts appear to represent the actual data?
Some days are close, but it’s not like it is really accurate.
Feb 11th = 60.9 the 10th = 63.3 yet the 11th is higher than the 10th??
Feb shows 29 days…
March 8th is 72.8 the 9th = 67.9 but the 9th is higher on the chart than the 8th.
Jumping on the band wagon…I noticed this earlier this week when the rain chart discussion was going on but chose not to mention it. In my case January thru August are missing day one of each month. In September day one shows but the graph only goes through 9/28. October looks Ok for me. This was just a cursory glance with no calcs done. Just looking at the absence of presence of temperature graph data for each day of the month.