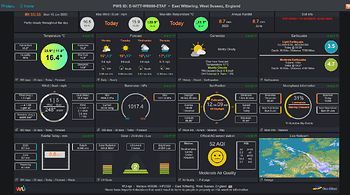
I now have the WD dashboard setup and working on my TV
BUT
I’m trying to understand the figures displayed on the WD
http://ewittw8686etaf.vastserve.com/pwsWD/index.php
http://ewittw8686etaf.vastserve.com/pwsWD/history_popup.php
I suspect the cron-jobs maynot be running OK , as the history file is wrong
But they do say in history they run OK
Using cron-job.org
If there is an issue, I can use BAT files to run the urls from the laptop
JUST NOT sure what files to check to see if the jobs have run correctly and updated
I have a Darksky API & also a Aeris API
The image below is using the darksky API
With Aeris I get different results in first box, “Just have a nice day”
With Darksky
In the first box top row , I get a forecast , BUT NOT with Aeris, I just get “have a good day”
The top row with Wind Gust & Temp 'TODAY" shows a time in the future , and the temps are for other days
Rainfall should be 13.6m from the console - But I adjust for an error on 9th JUne of 0.5mm , so maybe should show 14.1mm
Showing 8.7mm for month
2nd row
TEMP - shows the temps same as max and min in future and incorrect
Baro - the MIN 1004.3 , is this showing the min pressure ever, or in what period,
WU - 1004.3 was 6th June,
WU - 1001.2 was 5th June
4th row
Rain
Shows Yesterday as 4.1mm
WU 4.06mm 12th
Thanks ,
As i say , i’m hoping to understand how it box is derived and what info used
and also What files are updated on pwsWDxx so i can keep a track and fix

