As I recently upgraded to a Davis VP2+, I wanted to look at incorporating THSW as it seems like, in theory, it would be a better indication of what it feels like than heat index or humidex.
I did a search on this and see a lot of discussion about THSW and know WD does its own calculations for THSW and doesn’t get the value from the Davis console. But, it seems really odd that I am seeing quite a discrepancy between the two numbers (10+ degrees). Plus, the THSW from WD is showing up as quite a bit lower than the actual air temp (and the heat index) on a very sunny and hot day.
I know with low humidity, heat index will be below the air temp and I assume that might be the case with THSW but, as I say, it is a bright sunny day and I would expect that would bring it back up but I don’t know.
Does all this seem right? Attaching a couple screen shots for examples. Thanks!
Here you go - at least I think this is what you want.
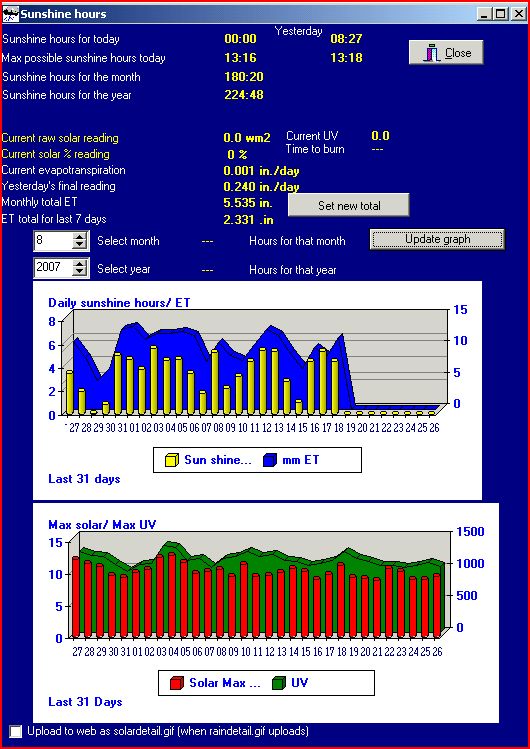
As I poke around a bit more… See the second screenshot. It appears my sunshine hours stopped calculating a week ago. Not sure what I would have changed to make that happen.
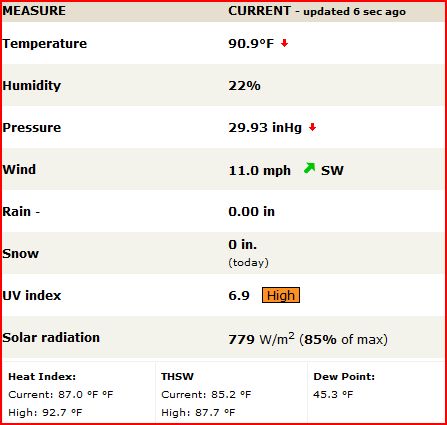
Console THSW High Today: 102
WD THSW High Today: 86.8
I don’t know… :dontknow: May not be anything wrong with WD - maybe its calculations are more accurate than the Davis console. I would be curious to see what others report.
Hello,
Is your graph still not working?
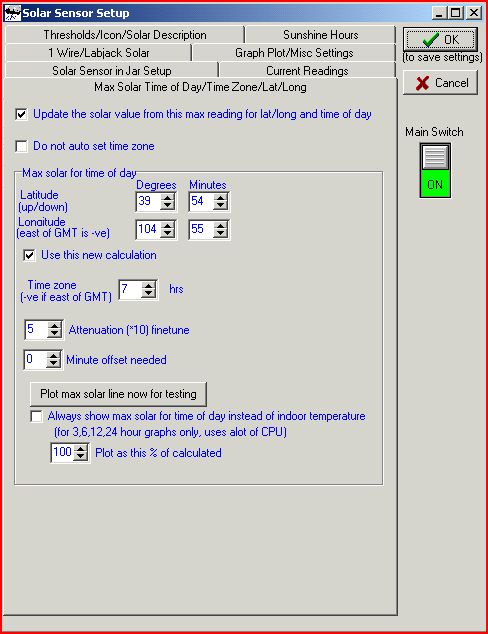
Have you accidentally unticked something along the way. I just added a solar sensor and realize how easy it is to do this :oops:
Have a look in your Davis settings and make sure all the correct boxes are ticked, I have a solar sensor, etc.
And just go all the way through.
Sorry if you have already done this but does not sound like a big problem I’m sure someone will be along with more suggestion’s soon.
Everything else related to solar seems to be working just fine. It graphs on the realtime charts / WD live just as it should, the raw files have the solar data, etc.
I have been back and forth checking every setting I can think of. Since WD is at least logging the data, I assume the stuff for the weather station type itself are set okay. Two things at this point just aren’t quite right:
The THSW in WD has a huge discrepancy between it and what the console says. I have verified lat / long and altitude on both and all is as it should be. I am in the Mile High City (Denver-area) so I don’t know if altitude and problem with the calculations that go on might be part of it.
The sunshine hours per day graph (screenshot above) seems to have stopped working a week ago. This makes no sense as you can see it is logging the number of hours each day just fine. Not sure what I did about that time to cause it to stop. The only thing I can think of is that I did go through and mess with the webfile creation stuff to turn off things that I don’t need. Not sure if that is where that image comes from or not but I can’t get it to show up now.
Have you tried the “convert solar log to solar graph” under the “Action” menu? If your log file is correct, i.e. one entry for each completed day of the current month, then doing the convert might get things moving again.
No, I hadn’t tried that but I just did and that didn’t work. Still not getting the sunshine hours. Any other ideas on that one?
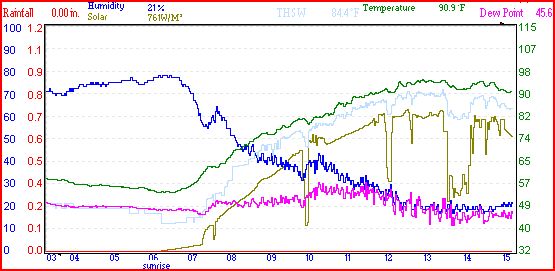
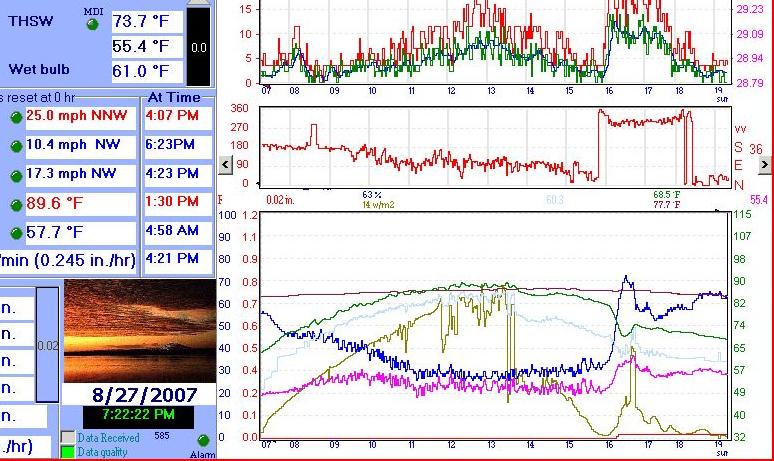
However, I just noticed something very interesting and odd with the THSW. Take a look at the attached screenshot. Of particular note is that in the text part of the screen at the top left it shows THSW as 73.7. However, if you look at the graph, it shows somewhere around 60 degrees (the light blue line). That 60 degree number is also what the tag delivers to the website.
So… There is some sort of discrepancy between the graph / tag and what WD shows in the text part of the main window. I hadn’t noticed that the THSW text was displayed on the main screen (like I say, I just got the Davis). Also, the text THSW is actually higher than what the Davis console THSW shows - this all initially started when I was seeing the WD THSW via the tag way lower than the console.
Okay, I turned everything off - all the solar stuff and even went into the station setup and unchecked the boxes that told WD I had solar and UV. Waited 10 minutes, turned it all back on and it didn’t help.
Now, I was searching and found this topic:
I notice what he describes is like what I am experiencing (the graph THSW being way off from the text) but there wasn’t a resolution posted. He mentions that when he goes into Setup, Advanced / Miscelaneous, Temp/Humid/Extra tab and checks “Apparent temperature on main window instead of wet bulb” things changed.
That box was unchecked on mine. If I check it, the text value for THSW then matches up with the graph! Why? I have no idea! Judging from my console readings, it should go the other way. Something is just kind of crazy with this.
yes, i need to simplyfy and re write my code dealing with all the options: heat index/humidex/THSW/apparent index/apparent index solar for graphing etc
i think there is some overlapping occuring!
Okay, I am glad to know I am not crazy. Definitely seems to me that the main window THSW is the proper number and the graph / tag THSW is wrong.
Any ideas on my second problem - that of the sunshine hours not graphing for the past week? As you can see from the screenshot posted earlier, it seems that WD is recording it properly - it just quite graphing. I have no doubt this is due to something I changed but I can’t figure out what it might be.
good that the THSW on the left is OK
seems like the one graphed is getting mixed up
(although i do know others have it graphing OK)
.zip and email me your settings files and I will do some checking of your settings (and for sunshine hours (do you see the sunshine hours increasing in wd?)
The ini file is on its way to you to the address in your profile. Hopefully you can find something - I know I’ve pulled most of my hair out.
For the sunshine… I finally fixed that. Not sure what happened but the sun log file for July was missing four days and August was missing one. I added a corresponding number of “dummy days” to them and that fixed the problem. It was kind of odd as the sunshine was reporting fine everywhere but the graph. All is well that ends well with that one.