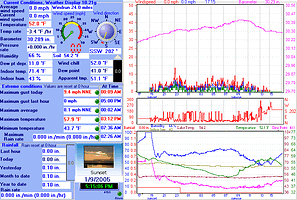
I have begun using an “extra sensor” to measure water temperature. In the graph setup I have selected “show extra temp sensor 1 instead of indoor temp on graph”. This is working fine. However, the change in the water temperature is slow and I would like to adjust the temperature scale range to show the rising and falling temperature more easily. I have attempted to adjust the various controls such as “maximum indoor temp range” and “max temp on scale” but it is not apparent what they are doing. Is there any way to just put in an upper and lower limit? (Attached is an example of what I have now…)
Thanks…
