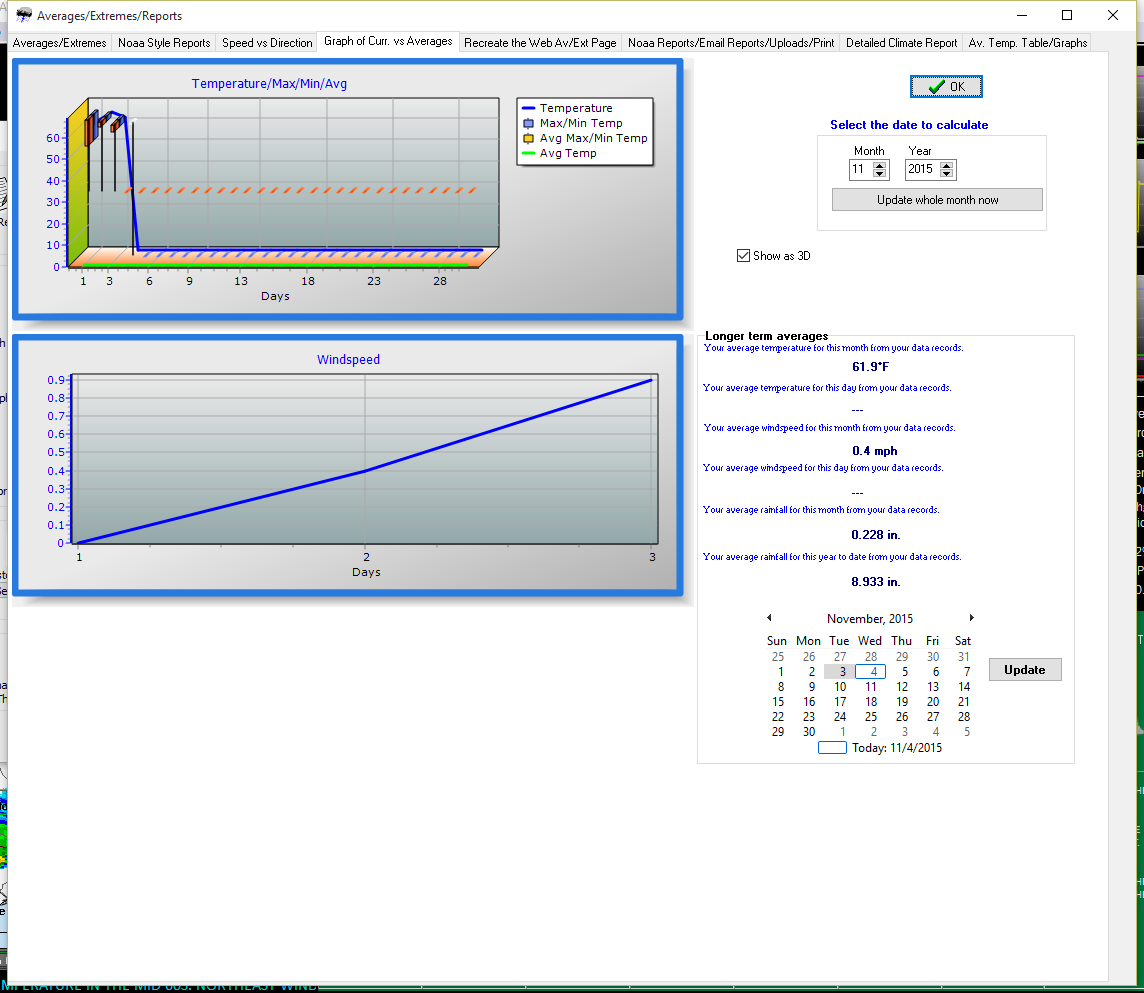
I have been receiving strange readings from my graphs the past two days. It is showing degrees of over 400. This reading does not show up in any data that I can find. Can someone please tell me where this is coming from? I am running the latest version 10.37R300 and is dated Oct 30, 2015. Any help would be appreciated. Attachment is below.
does it coincide with a daylight saving change at all?
No, it does not. We don’t change time until 2am this morning. It started it two days ago. Will recheck after 2am and advise.
if you could .zip and email me your data files
month102015.inf
and
last31daysdata.inf
and I will see whats up
Let me know if you need any other files. And thanks… This morning so far nothing. Have to wait until midnight to see if the temps still exist in the graph.
CompressFiles.zip (374 KB)
Hi
There was a bug in my code
use a new .zip update, ready now, to fix this ![]() #-o
#-o
Got it Brian. Thanks…
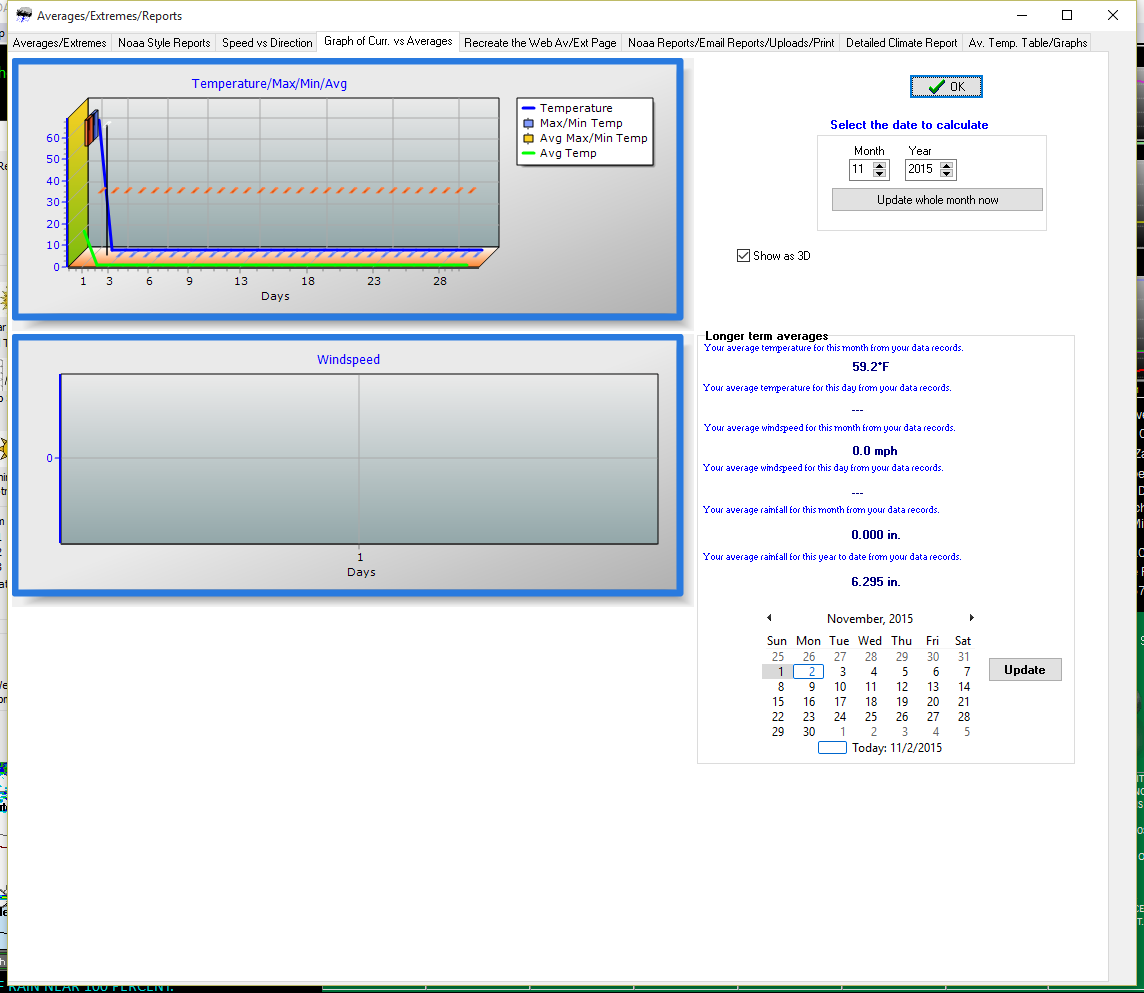
there is a line down to 0
but not a line up to 400
so its not the same problem