Hi there
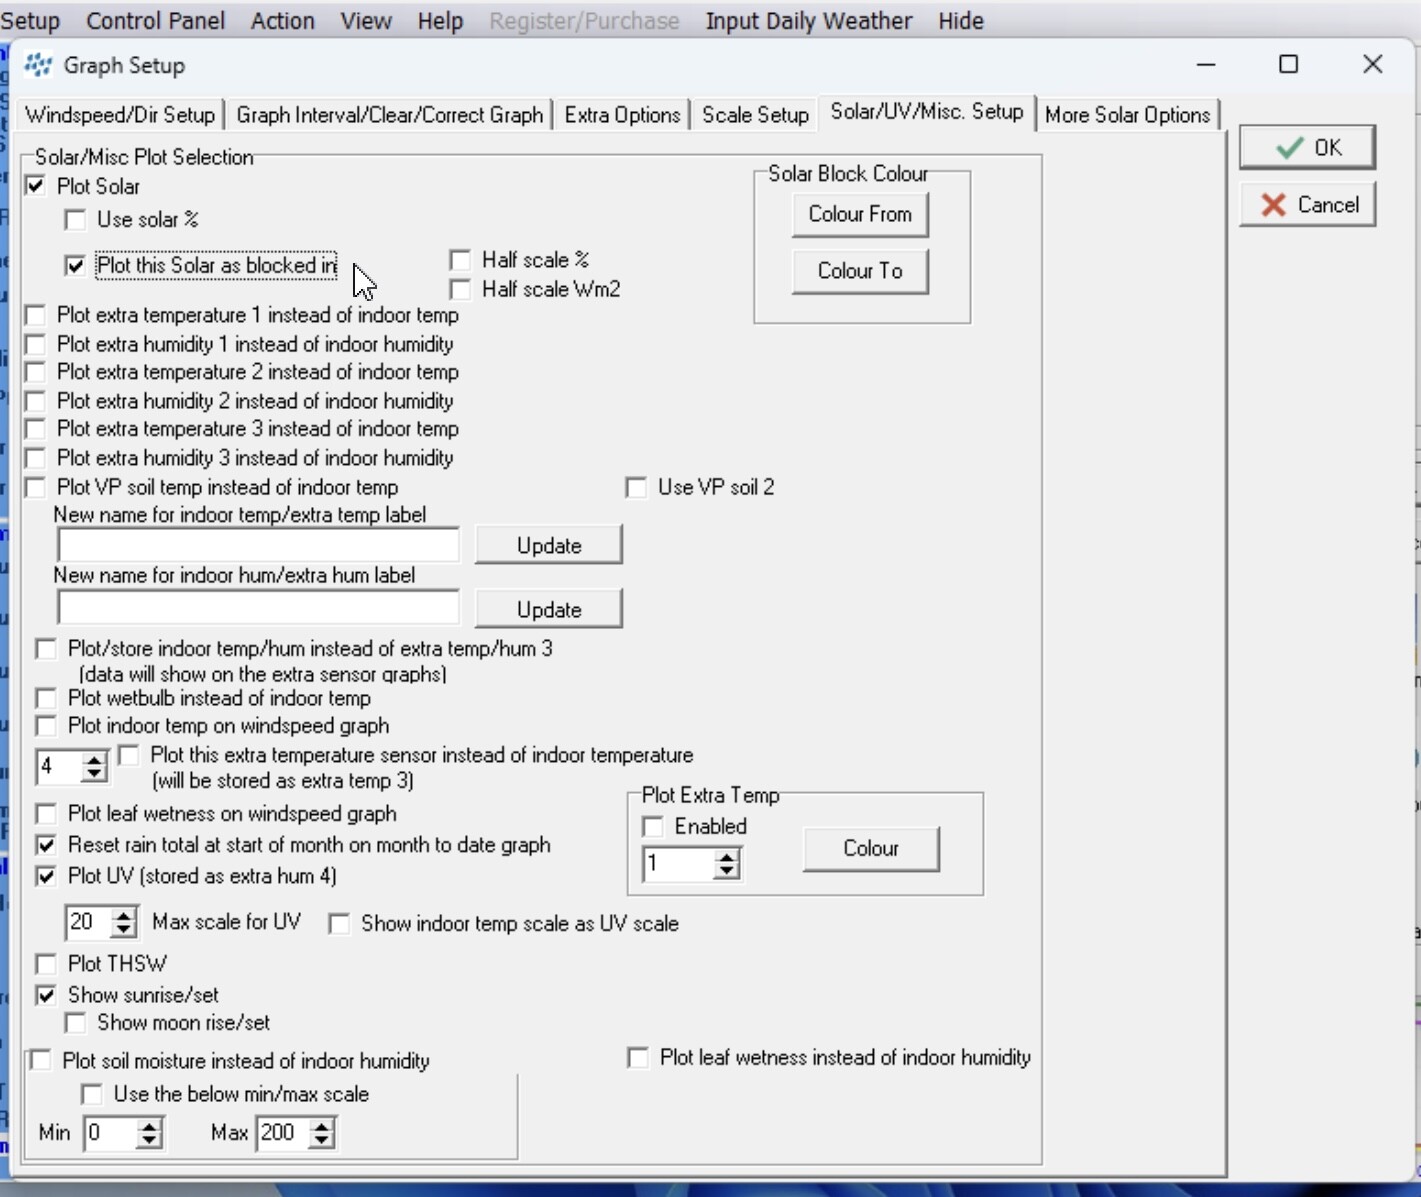
For the life of me I can’t remember where the setting is to make the Solar Graph, usually yellow, curved rather than blocked. Can someone please point me in the right direction?
Many thanks.
Chris
Cheers mate but unfortunately no. It’s still square rather than curved
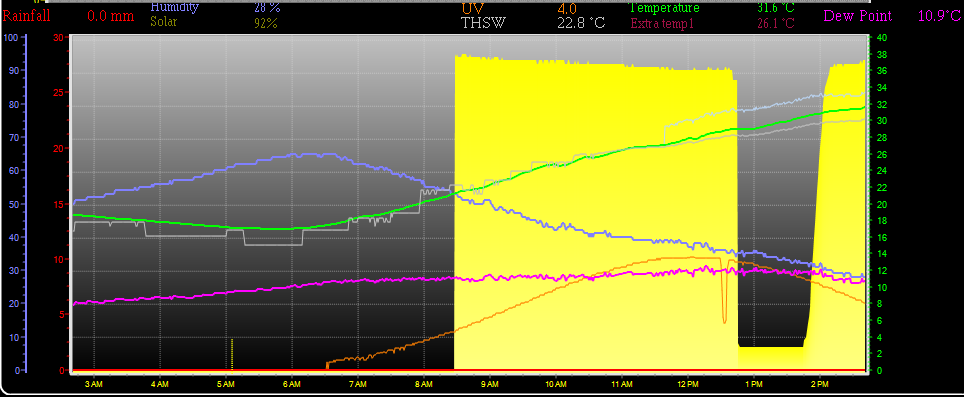
Can you post a screenshot?
That looks weird, almost as if your solar sensor is in shade and then full sunlight. I think WD is just plotting the data it gets from the sensor so that’s why it’s not curved. You may be thinking of the solar max lines, which would be curved because they’re calculated?
I have no idea. Possible sensor failure I think.
It look like the numbers on the right are single place. click on screen and hold down right key down and drag it down. It looks like it was pushed up. The numbers should 0 to 100.
It’s difficult to see anything on this pic. Key “Print Screen” in Windows has been upgraded so that you can choose an area to copy to the clipboard, which you can then paste into a post.
I still use Windows Accessories > Snipping Tool, which allows you to select the area you want to highlight and edit it, if necessary. Save this somewhere (I use a Temp directory) and then you can upload it to a post.
Yup I know it well. It’s the morning here, I’ll send a snipit later this afternoon when there’s more to show.
Many thanks
Chris
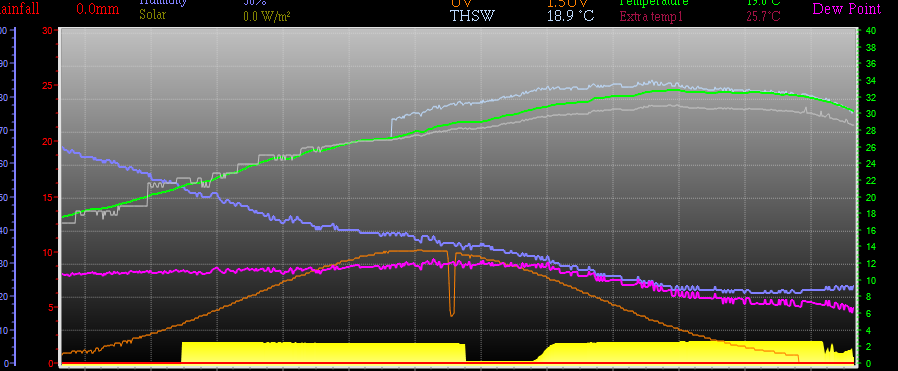
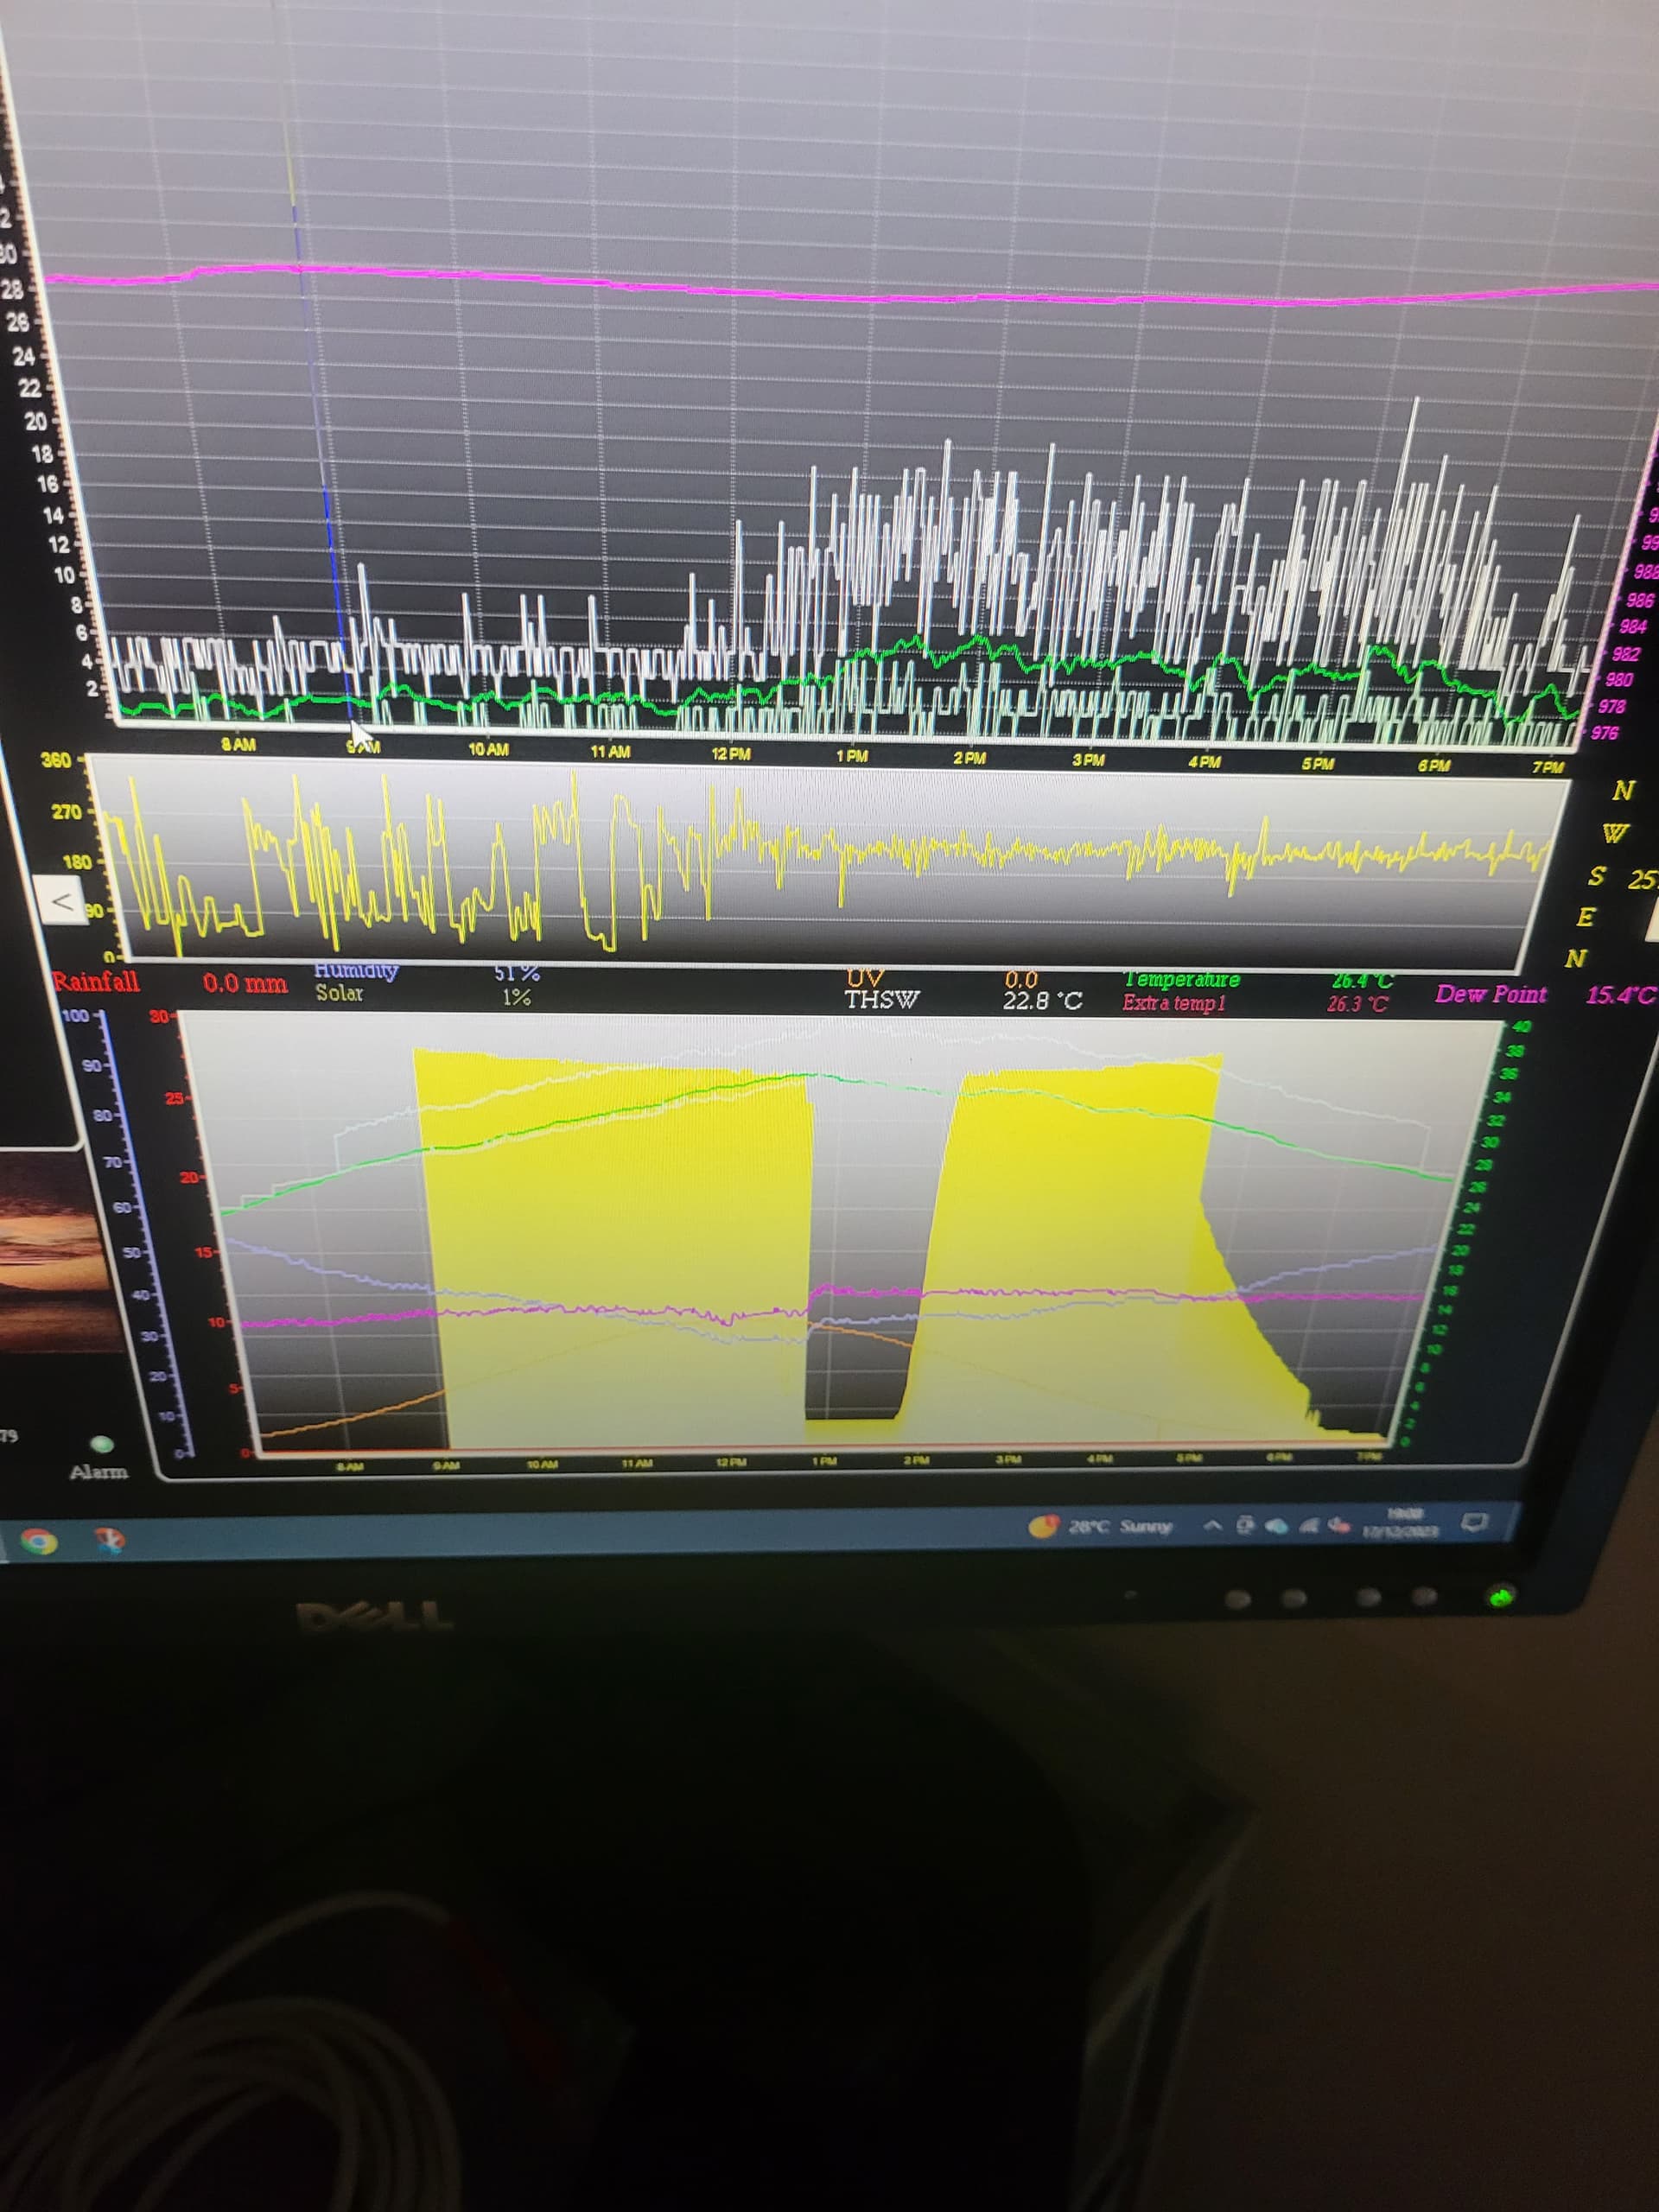
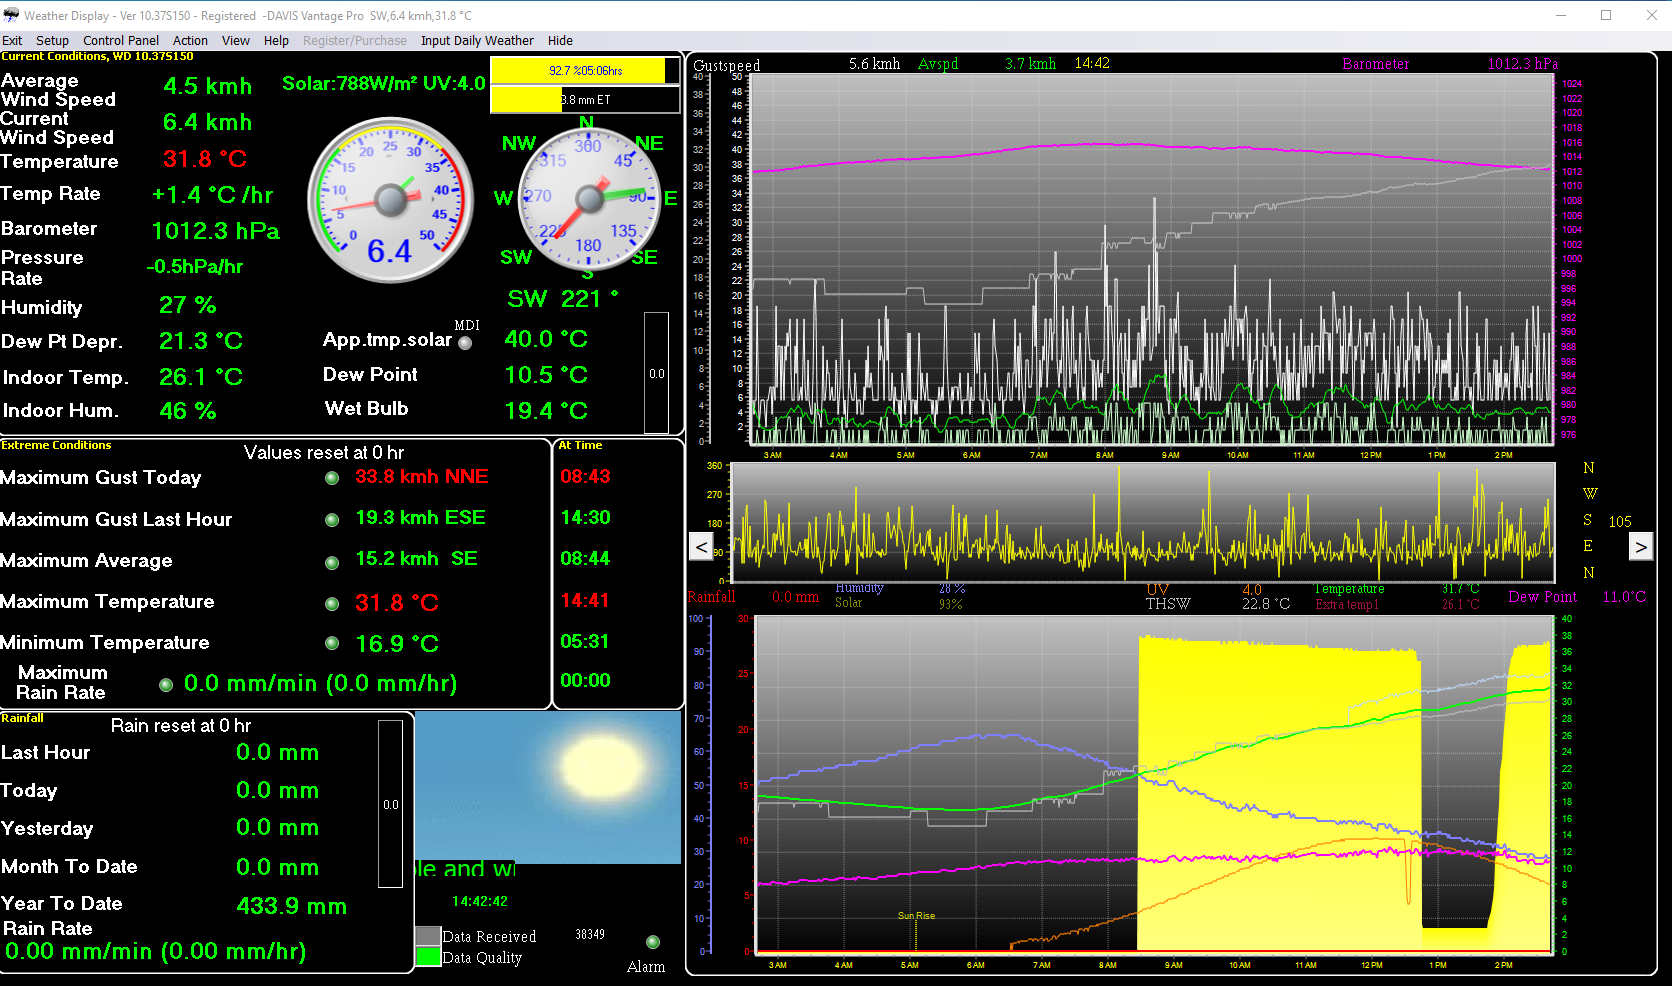
The screenshots. One is a full screen, the other is what I’m on about. The solid solar graph. It used to be curved. And that big chunk missing makes no sense.
The other issue is, that Conditions keep defaulting to overcast when it is not. I have to go into Control Panel>Solar Sensor, I change nothing and just press “Ok” out of it and Control Panel and it reads what it should be.
What station type are you using and what kind of solar sensor?
Davis Vantage Pro 2 with their sensors. UV and Solar.
It looks like you’re using a VP2 station, so I assume a Davis solar sensor? Are you collecting data using a WLL? If so are you uploading the data to WeatherLink? What does the data look like on there if you are?
Also are you able to briefly run WeatherLink software on your PC to see what values the sensor is returning? Don’t forget to set the port back to the setting that WD can read after this test.
I haven’t used weatherlink in years. I’ll have to dig out or download it I guess.
I just use WD to collect the data.
I think WL might help to either show the data from the sensor is wrong or if it’s actually a WD problem.
Don’t forget that WL will set the port into a mode that WD can’t access so you’ll need to reset it afterwards. There are instructions on the forum somewhere.
I now remember why I don’t use weatherlink. The software download does not work. Just signed up again, logged in, tried to download the software. Nothing happens. Tried a few times now.
![]()
I’ve not used it for years so I don’t know why it won’t work for you.
You have the use solar% in graph setup ticked that is why the plot looks like it does unticking it should sort it
Would suggest you check the sensor is clean as birds can leave messages on it
1 Like