After yet another WxSim data problem due to the database size growing too large I thought it was time to continue the project I started some time ago, i.e. improve the server monitoring process.
I’m using some software called Prometheus and Node Exporter to gather server stats and using Grafana software to do the clever stuff like producing fancy dashboards with status reports and graphs on them. I’d set this up some time ago and it’s been happily running in the background without any problems since then. I probably got distracted by something else at that point (a common story in my life!) and never got back to finishing the job off.
In the last 24 hours I’ve done a number of things…
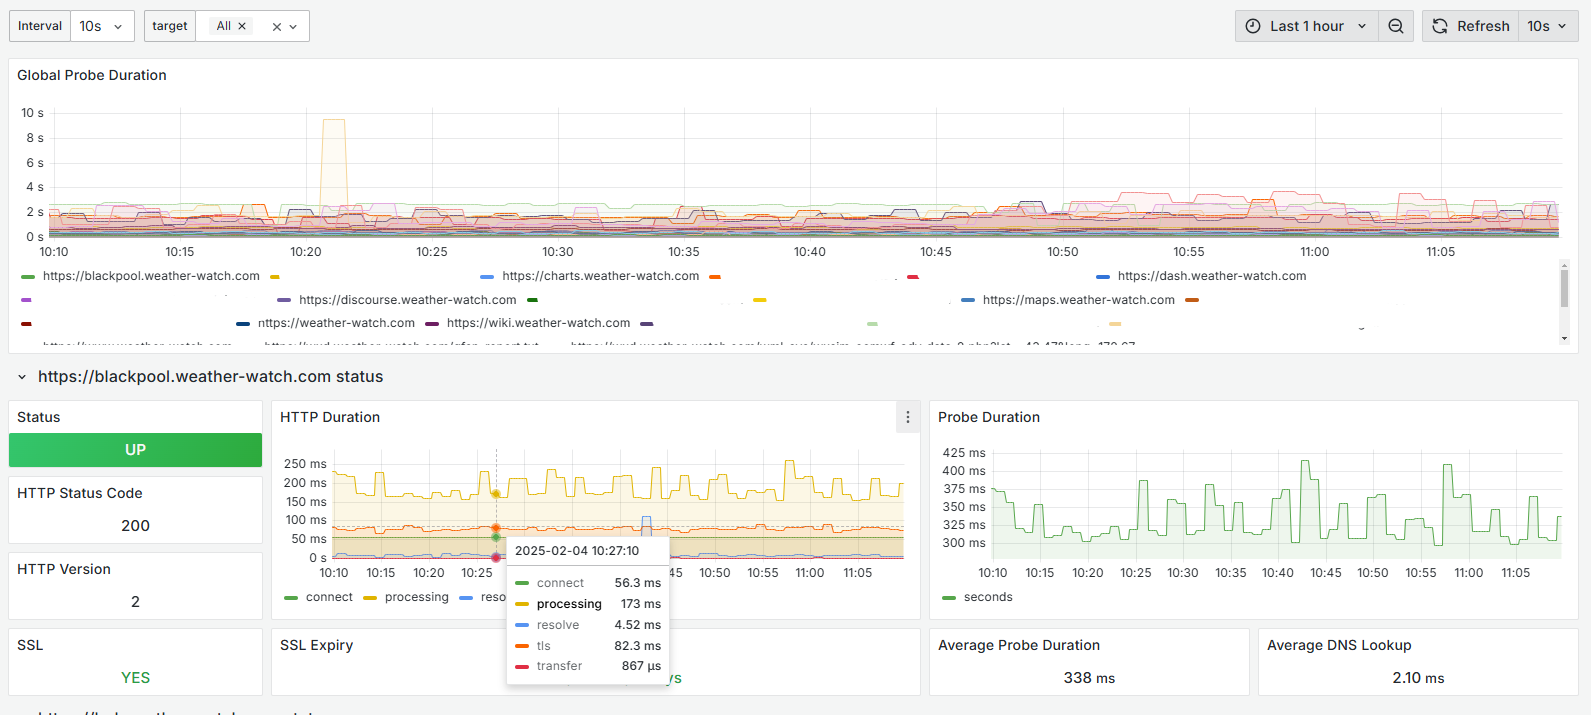
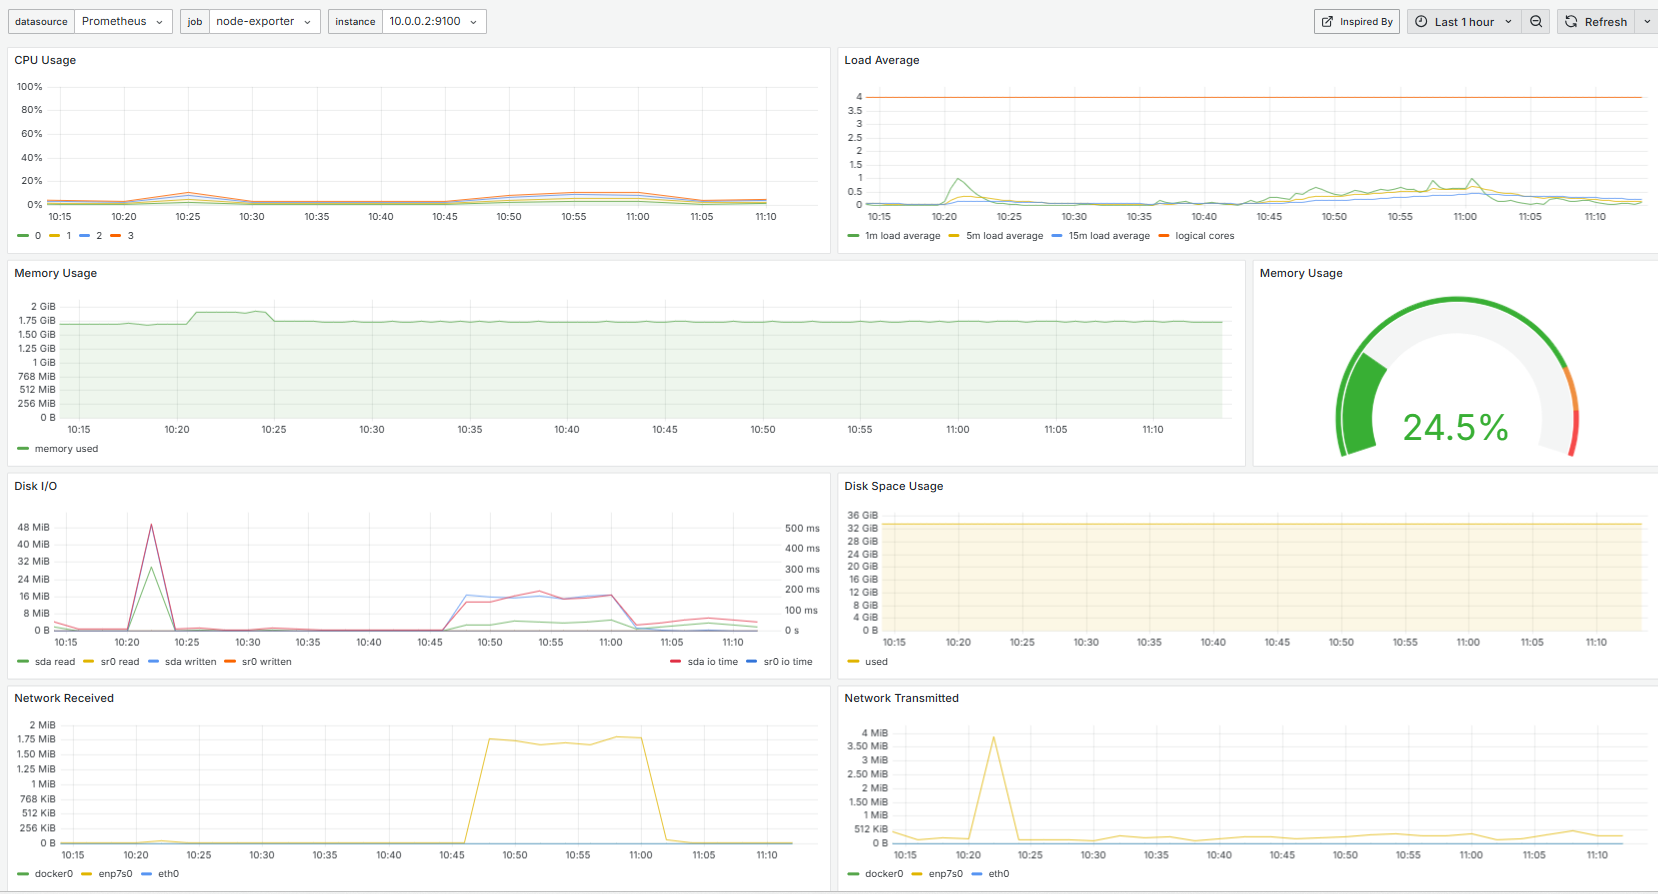
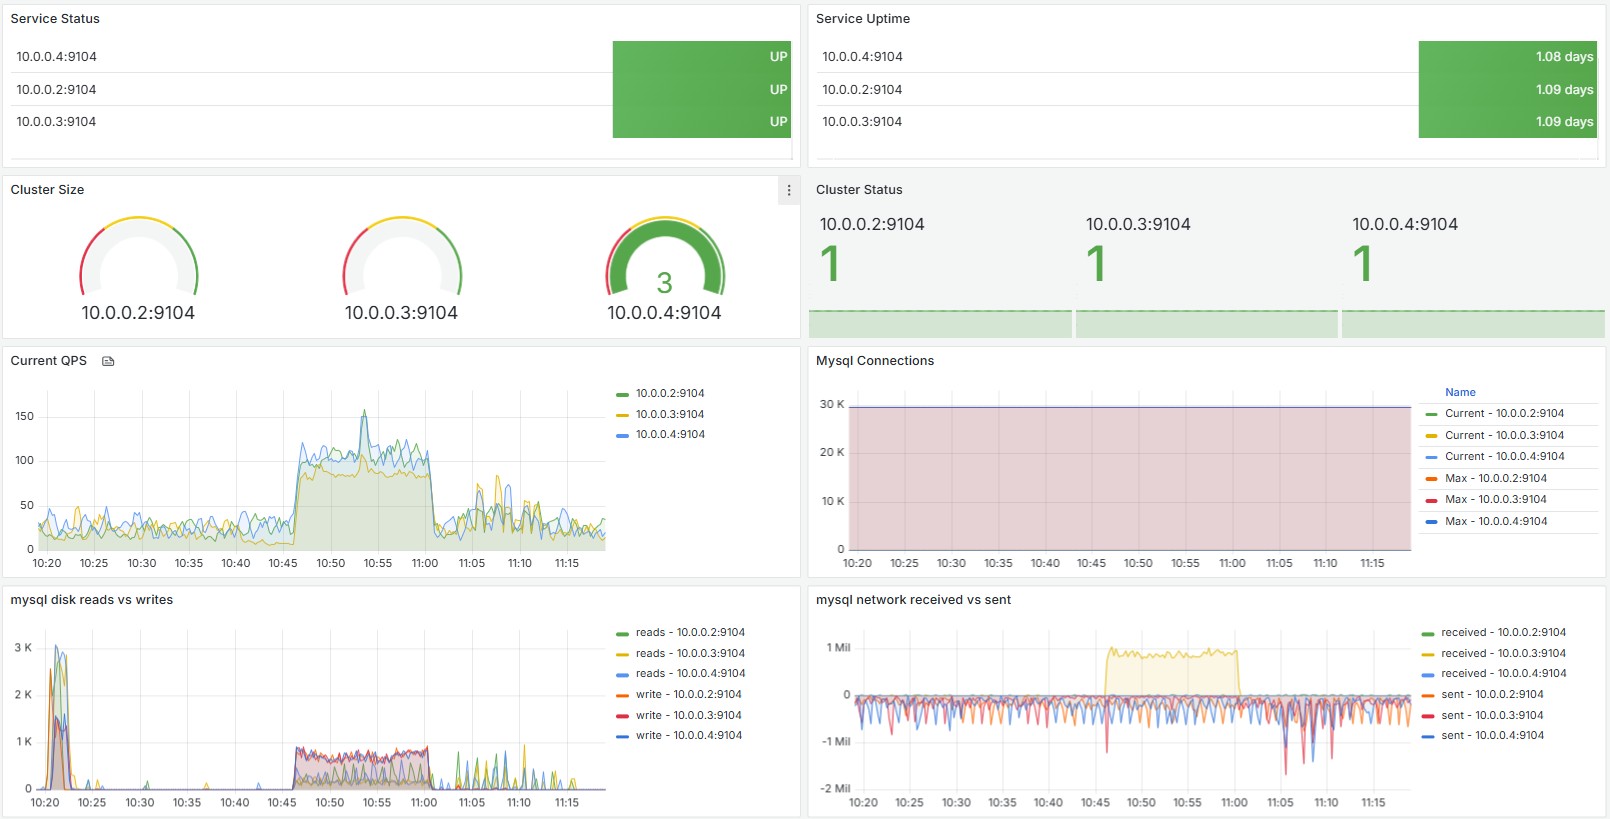
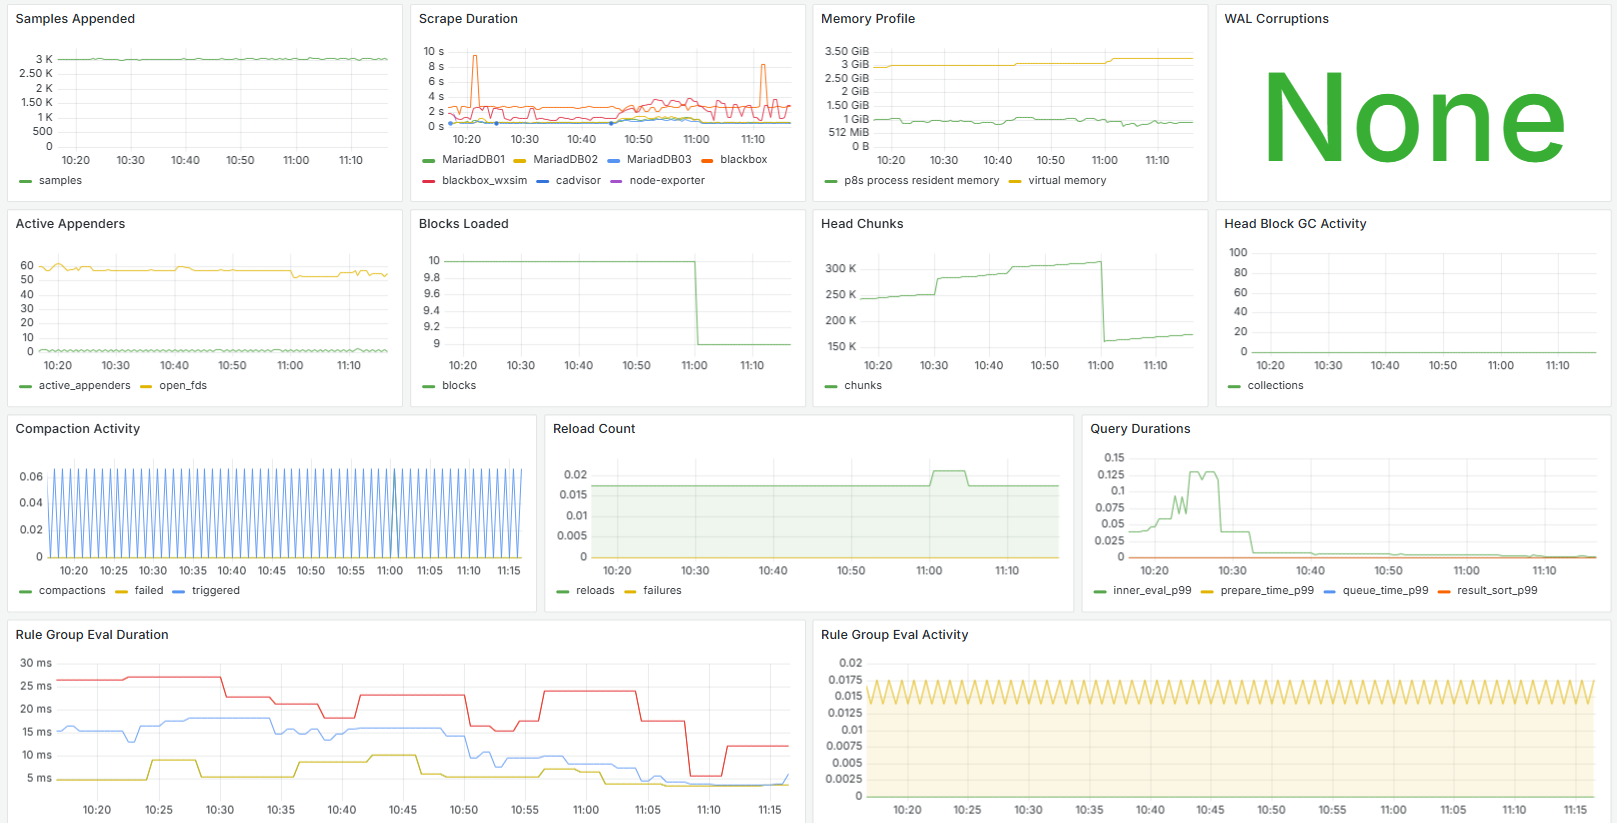
- Sorted out the dashboards to give me a good view of how the (6) servers are running. Some examples…
a) Status and stats for all of my web hosts:
b) Stats for each server:
c) Status and stats for the database cluster. The increased activity that you can see starting at around 10:45 is the GFS data download running.
d) And even stats on the stats gathering process:
There are other dashboards too, but these give you an idea of what things look like.
- Fixed the alerting processs. I’d started this last time but ended up going down the wrong road which made it difficult to send notifications. I’ve completely revamped the alerting/notification process now. So far I’ve got 3 sets of alerts:
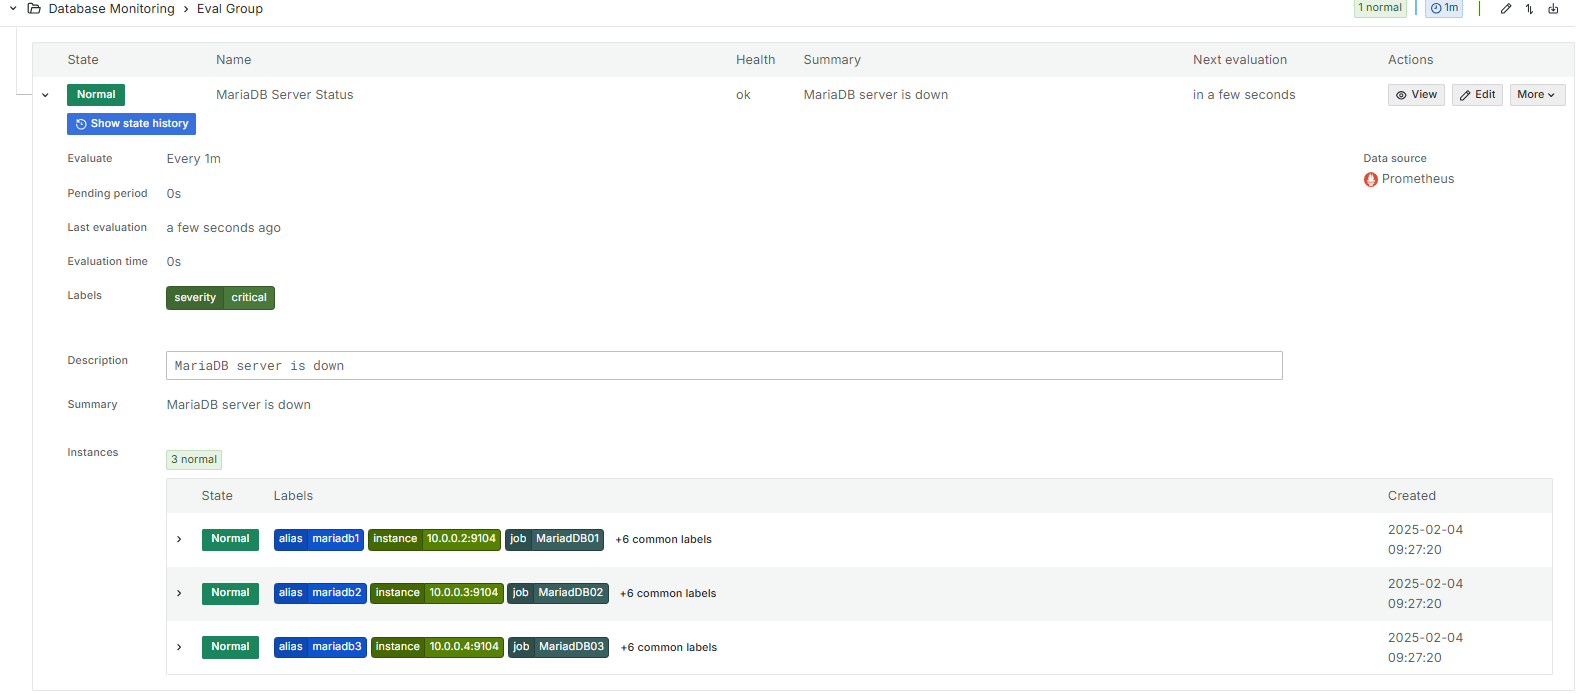
a) Database server alerts which send me an email if one of the three database servers becomes unavailable:
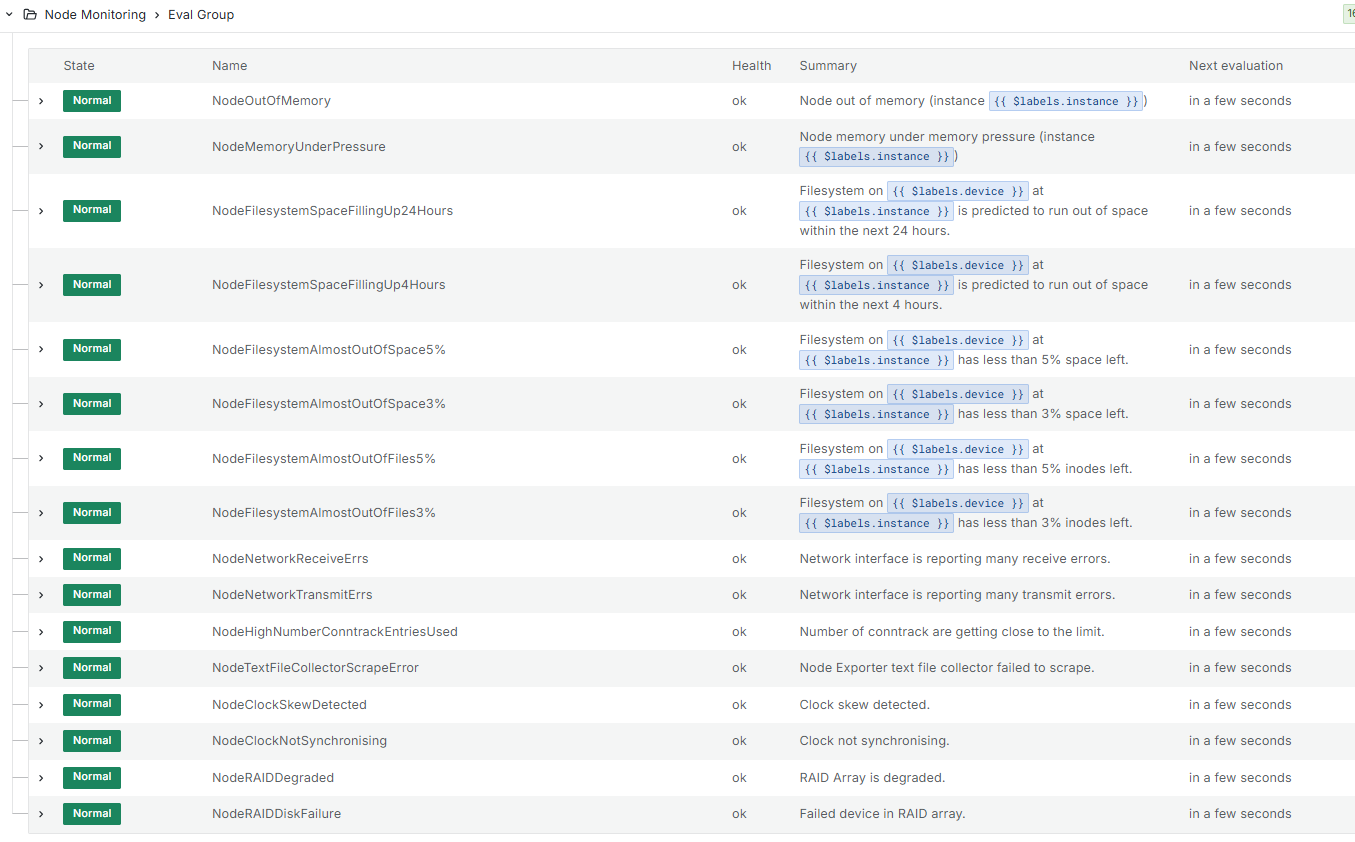
b) A set of server alerts which send me an email if, for example, disk space is running out on a server or there are network errors.
c) Some alerts about my web sites, e.g. if any site goes down or an SSL certificate doesn’t get renewed at the normal time then I’ll get emails.
- The dashboards above are all ‘standard’, i.e. freely available to import from Grafana. I’ve now started to create my own personalised dashboard to monitor very specific things that are of interest. For example, one of the recurrent database issues recently has been the WxSim forecast data table not being managed (old records removed) and eventually getting too big for the server to handle. So I’m gathering/plotting the size of that table.
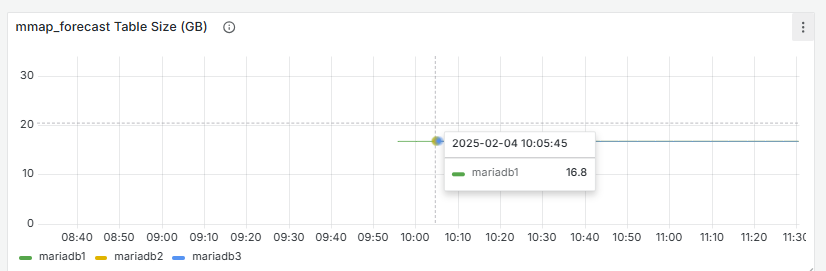
That’s a boring plot, but still useful. The table (on disk) is about 16GB. It shouldn’t grow (or shrink) because it should reach a maximum size, after which old records are purged before new records are added. The plot isn’t really necessary, but is a precursor to the next step which I’ll do later today - adding an alert.
As I’m now collecting the data required, creating an alert just needs me to replicate the formula used to create the plot in an alert and decide what the maximum file size is that I’ll allow before I send an email. So in future I’ll get an email if the database table starts to grow and that will give me time to react and, hopefully, resolve the problem before everything grinds to a halt.
That’s all for now folks - lunch is nearly ready!