Using rrdtool to collect and graph WDCOnsole data.
I wrote this up for a different site, but thought I’d add it here. Here’s hoping this time, as I had some trouble the last time I tried to upload this.
I used to have an old weather station which I used with the excellent open2300 scripts from Kenneth Lavrsen in Denmark to store data and graph it. When I left my previous company, my colleagues were so relieved they gave me a TFA weather station, which is a rebadged IROX USB system. This doesn’t work with open2300, and the software it comes with is Windows which I don’t run. Anyway, I didn’t want a snazzy app, I wanted to monitor the weather. Thanks to Brian, WDConsole supports this weather station pretty well. This worked with some AJAX scripts someone elsewhere on the web wrote, and I also found a utility that could read and graph mysql data which WDConsole can write to. But nothing with the simplicty of open2300.
Then I stumbled across a website talking about using rrd, the round robin database. What an amazing bit of work. WDConsole spits out a file called clientraw.txt every minute. NameBright - Domain Expired has a PHP Parser for this file so that you could easily read the field names - over 160 of them, though I was only interested in 12 or so.
So I created an rrd database using this script:-
rrdtool create TNCWeather.rrd
DS:tempin:GAUGE:600:-40:100
DS:tempout:GAUGE:600:-40:100
DS:windchill:GAUGE:600:-60:100
DS:humout:GAUGE:600:0:100
DS:humin:GAUGE:600:0:100
DS:windspeed:GAUGE:600:0:150
DS:gustspeed:GAUGE:600:0:150
DS:winddir:GAUGE:600:0:359
DS:baro:GAUGE:600:0:1200
DS:drain:GAUGE:600:0:200
DS:cloudheight:GAUGE:600:0:25000
DS:rrate:GAUGE:600:0:200
RRA:AVERAGE:0.5:1:288
RRA:AVERAGE:0.5:3:672
RRA:AVERAGE:0.5:12:2916
RRA:AVERAGE:0.5:288:365
I then found an awk incantation which would read the relevant bits out of
the clientraw.txt file straight into the rrd. like this and which could be put into a script:-
#!/bin/bash
###Populate database with latest data
rrdtool update $DBLOC cat $LOC/clientraw.txt | \ awk 'BEGIN {FS=" "} {print "N:" $13 ":" $5 \ ":" $45 ":" $6 ":" $14 ":" $2 ":" $3 ":" $4 \ ":" $7 ":" $8 ":" $74 ":" $11}'
This fires off every 5 minutes via a cron entry. A script I called weather-to-rrd.sh calls the graphing script with appropriate parameters. If the forum software allows, I’ll add a zip file containing all of this.
Then, a script generates the graphs. I managed to use parameters for this so that one script generates hourly, daily, weekly etc graphs. It’s longish, so I’ll add it as an attachment.
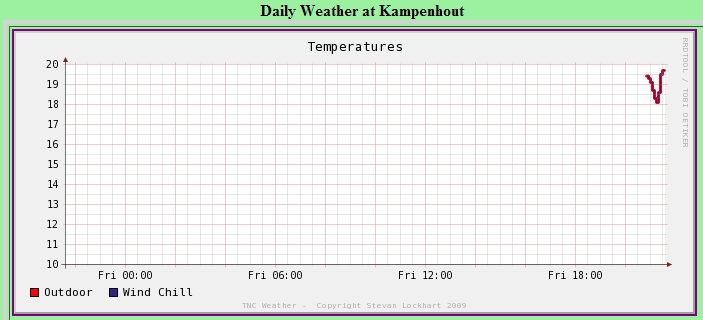
Finally, a horrible bit of html displays the various graphs at 3-hourly, daily, weekly and yearly intervals, with varying amounts of averaging of the data, as shown by the rrd creation script.
I use this data internally and via a password protected area on a website, because my bandwidth is limited.
Hope this helps someone. I know the scripts are horrible, but I’m not a programmer. Please feel free to improve them, and hopefully post up your improvements.
Stevan
wdgraphing.zip (6.01 KB)