The main sensor reader executable is now being tested. It reads the sensor (via the Bosch library), formats the raw data as JSON and sends it to a MQTT topic. It has a config file and sends error/debug logs to it’s own file. It doesn’t have any units conversion, so temperature is only available in Celcius. The code will need some tidying up before release but I’m waiting until I’m more sure that it’s got all of the relevant functions before I do that. The main thing is it works.
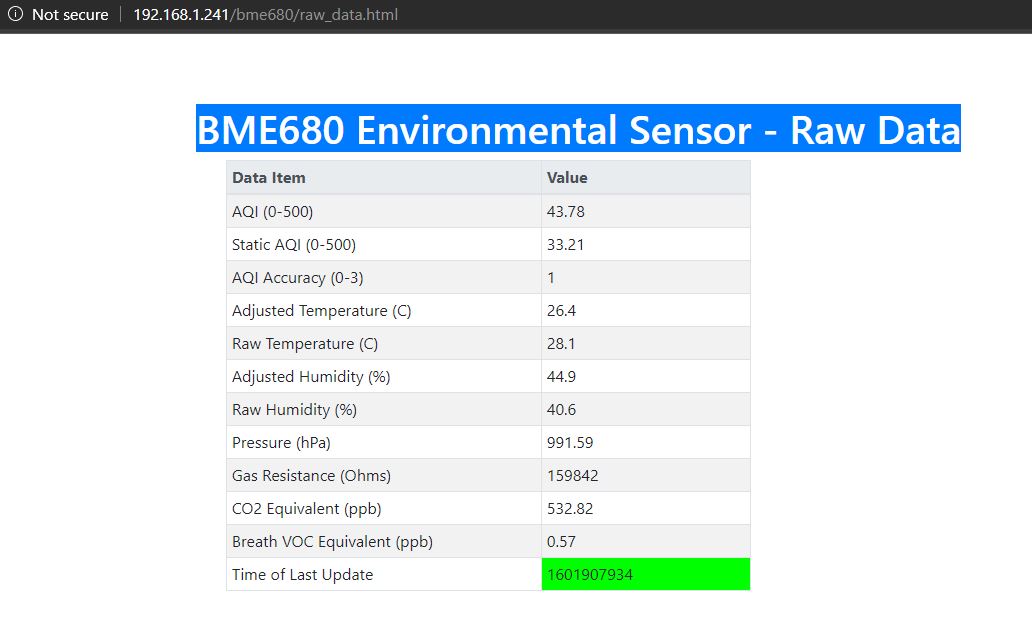
I’ve also created a basic web page that displays the raw data as it arrives from MQTT (see attached).
Next step is to move into Python and start consuming the raw data from MQTT and doing more with it, e.g. storing it in a database to allow more complex web pages, e.g. graphs, to be generated and also to provide some processed data MQTT topics.
I don’t have any documentation for this yet, but if anyone wants to try what I’ve created so far I can create a bundle of files and brief instructions on where to put them to make things run. It won’t be running as a background task or be anywhere production ready, but might allow others to start to see real data from their sensor.
Oh, and I’m pretty sure that this sensor is going to need to be mounted with a good flow of air across it so that that warm air from the Pi doesn’t affect the temperature so much (it’s not 27C in my house!) and also so that the air being sampled for AQI doesn’t get stagnant. I’m sure a small fan will suffice but I’ve not got that on my development Pi at this time so my data might look a little odd in some respects.
The basic Python framework to handle the raw MQTT data is now written and functional. At the moment it’s just regurgitating the raw data into another MQTT topic which isn’t very useful, but it proves that the essential functionality (reading config file, setting up processing queues, creating functioning MQTT reader and data processing processes, and logging) is working.
Next steps are to create a SQLite database to hold the data and then start writing queries to generate data of interest, e.g. averages/highs/lows per minute, hour, day, etc. The database will be available to anyone with a wish to access/process the data on their own Pi.
I’m still thinking of how to provide the data once it’s available. Unlike the lightning sensor project where we’re mostly only interested in the current and near past, this project has a lot more data and it’s likely that people will want to view it in many different ways, including ways that I’ve not considered. So sending limited subsets of data by MQTT probably isn’t going to work. I could create topics to hold the last 10 minutes data, but what if people want 10, 20, 30 40, 50, 60 minutes worth of data? Or daily and monthly data summaries but others want weekly, or want to look back at the daily data from 6 months ago?
To present the data in a browser requires some server side functionality to do the required database queries. So there could be code in the form of Python (cgi-bin Python is already available on the Pi but is slightly messy to use) or PHP (which is neater to use from a web page perspective but would need installing), or using some form of framework to create the web site, e.g. Django or Web2Py (both of which need installing and add considerable complexity).
As I said, I’m still thinking about this but if anyone has any suggestions of how it might be done please feel free to comment. I’d welcome your thoughts.
A bit more of an update. I now have getting on for 4000 records in a SQLite3 database and can do manual queries against it, e.g.
SELECT time_hour, avg(aqi) as AVG_AQI FROM raw_data GROUP BY time_hour;
gets me…
12|74.2826227795193
13|73.06965
14|104.836625
15|164.14856975381
The first two digits are the hour, followed by the average AQI for that hour. It’s quite variable so it’s going to be interesting seeing plots of different time periods to see if I can see what causes the peaks troughs.
I’m now experimenting to see how I can get the data onto web pages and create graphs.
Progress is a little slow. I have another non-IT related project that I’m working on which limits my development time at the moment.
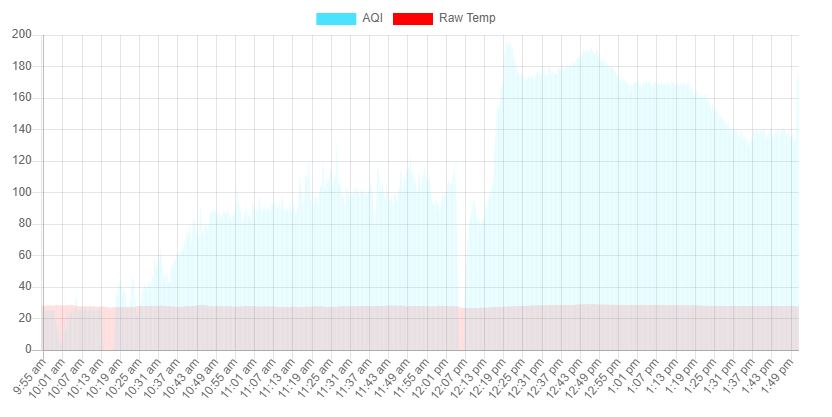
However, I have made some progress. I’ve decided that the easiest and simplest way forward is to use PHP. That gives me lots of options of what to do with the data. Apache was installed by people using the AS3935 lightning sensor so adding PHP onto that isn’t a major step. I’ve created a couple of demo PHP pages that chart some data from the BME680 dg (see attached). They’re just some quick examples of what can be done so not optimised and not actually showing much sensible data at this stage. They do prove the mechanism works so I can start turning the demo code into real code and create some useful charts. It will also be relatively easy to add more charts which just add onto a distributed set, so these can be provided as additional downloads. If you wanted to use one then you can just download a couple of files and copy them into place to be able to use them.
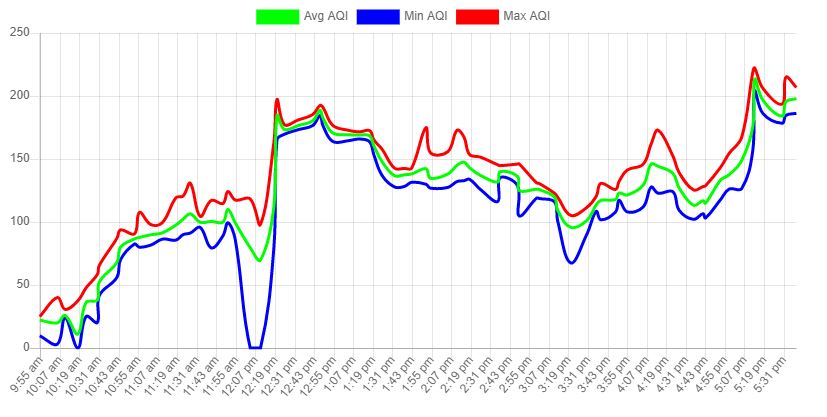
This is a nicer looking chart. Min, average and max AQI from after my Pi restarting Pi this morning (actually an electrician restarted the Pi when he tripped an RCD).
After a brief hiatus I’m back in the saddle again. I’m away from home at the moment and haven’t managed to get the Pi set up in the current location. However, I took the Pi back home today and have added some port forwarding to my router to allow me to get into it remotely. I’ve tested that this evening and I can access it in the ways I need to.
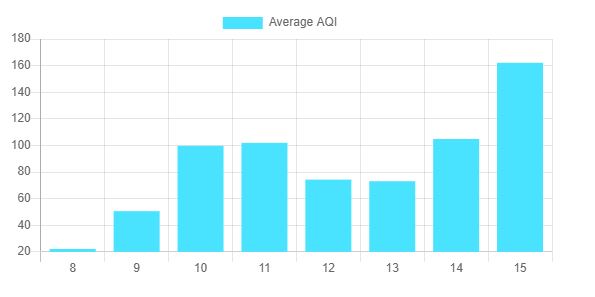
I’ve been doing some experimentation using Plotly to generate the charts and I finally got it working (reading data from a database using PH then communicating the data from PHP to Plotly by Javascript and JSON proved to be a interesting challenge…but one I’ve now overcome. Plotly adds some useful extra features, e.g. the ability to manipulate the chart a little using a standard memory. For example, it’s possible to have a chart showing data for a week and then zoom in by selecting, say, 12 hours of the plot. The attached image shows a basic bar chart of AQI data with the Plotly menu in the top right hand corner. It’s a very basic view with a silly X axis but I’ll work on making a better example now that I’ve got the basics working.
I think I’ve sorted out my confusion with Plotly now and have started to make some nicer charts with the ability to zoom in/out, select sections to display in more detail, etc.
I’m also getting more impressed with the air quality sensor. You can nearly use it as a burglar alarm! The attached image shows the min/avg/max AQi readings for this morning. We’d been out since early in the day so the AQI level was pretty low. We came back into the house at about 10:05 (from the alarm panel logs) and by 10:06 the levels are already rising. That’s impressive given that there’s no forced air movement past the sensor (no fan at the moment) and I was at best about 3-4 feet from the sensor at this time.
I’ve had a few issues with my BME680 code stopping randomly and I’m trying to find a pattern to it. If I can fix that then we might be getting close to a v0.5 release. I still want to do more but I’d like others to be able to test the code too to see if you can spot anything that I’ve missed.
I think I may have discovered what was wrong with the BME680 process stopping. I don’t think it was actually stopping but the way I was processing the data for display made it appear as if it had stopped. I need to run it for a little longer to confirm this.
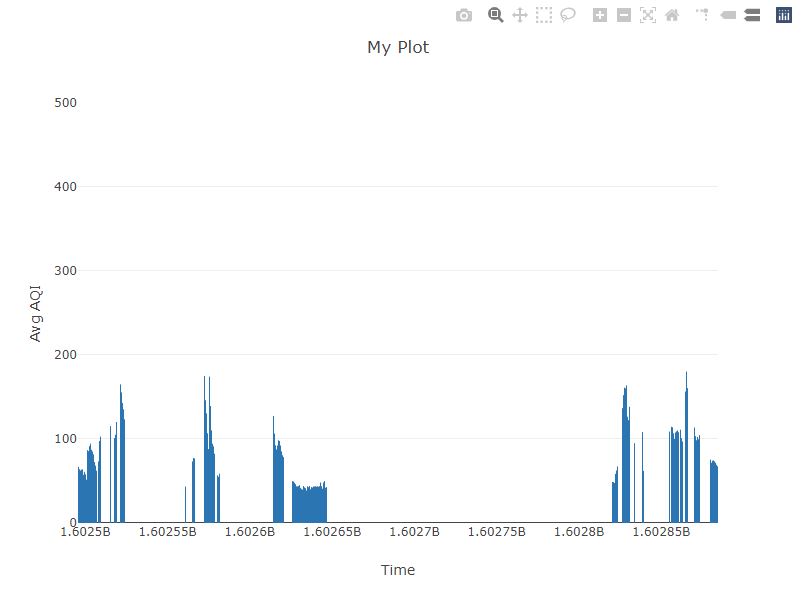
I’ve now created a couple of web charts as well as a character based display of current conditions that I think will be the basis of the BME680 output for now. Examples of the two charts are attached. You could write others using these as examples (Plotly is a very nice Javascript component with many features) or if there are a few suggested favourites I could add extra charts.
I’m going to stop playing with Plotly now though. Next steps are to tidy the code up, e.g. remove debug code, make the two background programs run as services and then create the installer script. Once that’s done I can move onto improving the code. The BME680 has lots of config options and I need to explore them to see what is (or isn’t) useful.
I’ve not forgotten about this. I’m in the middle of moving house and have lots of little jobs to do at the new house to be able to complete the move. I’ll get back to this project ASAP.
House comes first! I’ll just keep watching the posts. The graphs look good,
Hi Chris,
Anything yet on a web page display of the data?
Thnks,
Mort
I’m getting closer to getting back to this. My weather station is half installed at the new house. I got the rain gauge/temp/hum module installed onto its post yesterday. I’m now working on getting the mast with the anemometer and UV/Solar sensors installed, but that needs a bit of ground work doing to level where the base will sit. Once that’s done I need to get the Arduino relay working, the console set up and reconfigure my Pi consolewd to work at the new house. That sounds like a lot, but I’m hoping to have most of that done this week.
I’ve already got the development back up and running at the new house, and did a little work on the web interface. I have some examples working, but need to decide on the best view of the data and then create that code in a manageable way. At the moment it’s more Proof of Concept code so it needs a fair but of tidying up.
Thanks for the reply, Chris.
Sounds like you have a lot on your plate.
I’ve got weather station issues here. I rebuilt my VP2 last fall and it now merrily chugging along. A couple of weeks ago I noticed that my wind speed always reads calm. It’s on the roof. A quick look and it’s not turning. I’m too old and unsteady to venture onto the roof now. My wife, bless her heart, volunteered to pull the pole down and let me refurb it. It’ll have to wait for warmer weather though.
Anyway, I’ll just keep checking the board for updates.
Appreciate it,
Mort
I’ve got my weather station working again now and have consolewd set up and collecting/reporting data, as well as a basic re-install of WxSIM giving me some forecasts, so it’s time to get back to C and Python code. I’m refreshing my memory of where I was up to and have started generating a list of “next to-do’s”.
I’m thinking of releasing a v0.5 version which isn’t feature complete (are projects ever complete!). This will give people something to start looking at data from the chip and confirming that my approach to accessing the chip can be replicated to other setups. It will be possible to access the data from MQTT and I’ll provide one or two web pages to display the data in a graphical form.
I’ve also got a case printing at the moment for my Pi, plus shield boards, plus a fan. It needs to be 2.5 times the normal Pi case height which is why it’s a special print. I’m hoping that will stabilise the temperature sensor which I think is affected a lot by the gas sensor heater, as well as bringing ‘fresh’ air past the gas sensor on a more regular basis than possible in a completely passive system.
That sounds interesting. Please post a picture of the case when done.
This is the case… https://www.thingiverse.com/thing:4059929
Attached is the start of the print (including external supports). It’s about 14 hours to print the main case…the top will take a bit longer.
My 3D printer developed a fault which needs me to source a replacement part. So it’s out of action for a little while and the printed box isn’t going to happen, at least not just yet.
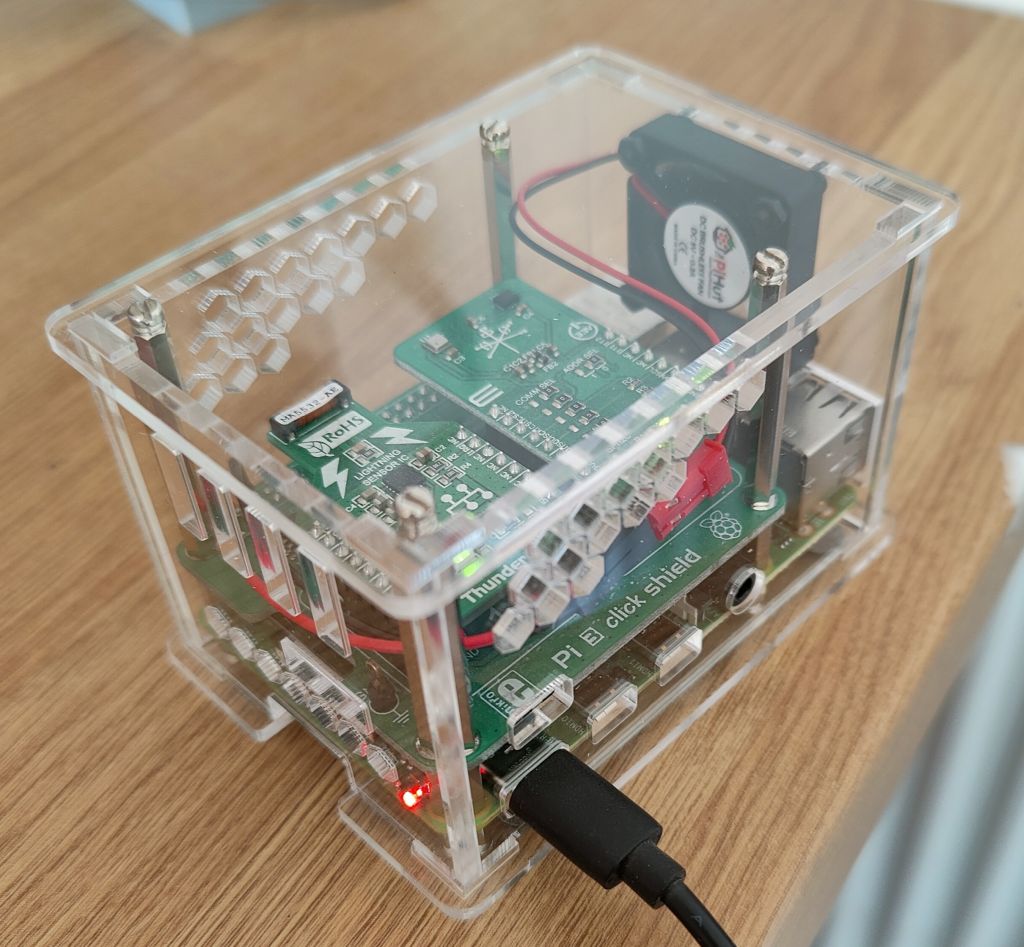
However, whilst looking for something else, I came across the perfect box for this project (see attached). It’s from ThePiHut (Cluster HAT Case v3.0 | The Pi Hut) in the UK but I suspect you can buy something similar elsewhere. It’s intended for a Cluster HAT but the extra vertical size is good for the shield boards. It also looks nice, although I suspect it won’t be so good when full of dust :lol:
I put a 30mm fan in it (the case is pre-drilled for one) and had to extend the fan wires to reach the Pi GPIO connector. The fan should keep a nice supply of air across the sensors which means the BME680 temperature sensor shouldn’t be affected as much by the heat from the Pi. It also means the the gas sensor will have fresh air to sample rather than the potential for stagnant air surrounding it.
That’s ideal for the shield boards!