@Ex-Whr
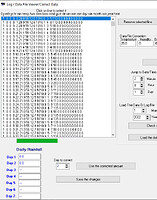
if your WD logfile data is correct
then try converting the WD logfile to data file (via action)
I am not seeing this problem here myself and I do not have any other reports of this particular problem as described here
Brian
I am have same problem and Ex-Whir as reported in this post and many before that.
As I am not computer savey, I would appreciate it if you can explain the procedure step by step to convert the log file.
Regards
Allan
Brian
I have asked this question before.
Can you please explain where the Detailed rain chart gets it's value for the "Wettest Year Total" rainfall from. ??
AS can be seen in the two attachments of DRC chart the values are inconsistent and way of the mark…
Apologies for missing last part of previous post
Can you please explain where the Detailed rain chart gets it’s value for the “Wettest Year Total” rainfall from. ??
AS can be seen in the two attachments of DRC chart the values are inconsistent and way of the mark…
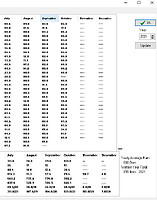
AS shown in shot of 29-10 yearly total for 2021 is 932.2 mm, yet the “Wettest Year” value is 855. 4 mm for 2021
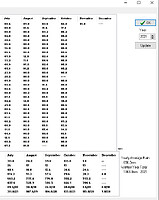
and screen shot for 1-11, show yearly total 933.2 (correct) but a “Wettest year” value of 1068.0 mm…
value is some 76.8 mm LESS than year total of 932.2 in Oct, but 134.8 mm MORE than the actual total on 1st of Nov. …???
Ex-Whr
I have the exact same issue. My wettest year (this year) is 114.4mm above what it should be. Surely the 9am rainfall reset is not the issue here.
One of my usuall issues on Detailed Rain Chart showed up at the beginning of this month. The first of the month had rain but all that was visible is — and was only corrected by itself after 1200 hours today 2 Nov.
Have you converted your log files? If so. How have you done that? I have had no reply on this matter from my post of 3 weeks ago. Do you have to do this every time you restart the computer, or close WD down?
the wettest year data uses the rain totals for each month, for each year, that is stored in the wdisplay.ini settings file
e.g what you see under view, rain chart
so make sure those totals are correct for that year
(there is an auto check/adjust of the month rain totals in logfiles in a recent update of WD under view, rain chart, that you can click on (assuming your logfiles are correct (back up your wdisplay.ini file first))
Brian
Thanks for the “fix” for the ‘wettest year’ value … I assume from the title of the button, this applies to ALL months,
and it was nice to see the “completed” statement when done.
Can you add this to other areas were corrections or adjustments are done and there are no notifications that the action has been performed …??
JohnY
Brian
Attached screen shots from this mornings 9 am rainfall detailed rain chart with 6.0 mm of rain NOT recorded on DRC, but total for month is correct @ 7 mm, and recorded in “Rain to date” window.
I have converted log file as previously advised with NO resulting correction to DRC. Previous 0.0 mm of daily rain are recorded without problems (?), but when a rainfall event does occur, it is not recorded . ??
… and again I ask for conformation comments to be shown in windows when an action to correct data id made to confirm that the action has been made …
John Y
I switched to the 9 am rain reset about 3 yrs ago so I could calibrate the Davis pro with a CoCoRaHS Rain Gauge, (I didn’t want to get up at midnight and dump the manual gauge) really caused issues but at least I got the Davis pro calibrated. So like right now it’s 2022 and my rain totals won’t be totaled till 9 am. we’ve got a cold dry spell for the next few days so I’m switching back to the midnight reset
Brian
Brian
It appears that we have a problem with new year rainfall …
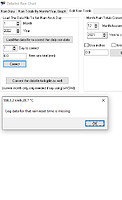
As can be seen from attachments, the 0900 reading for the first of month is not being recorded in Detailed Rain chart (0.0), and as an attempt to correct this failed using the ‘Edit rain total’ on that chart, gave me the error message " log data for that time is missing" …???
Yet according to the Log file viewer for 0900 on 1st ALL data is there … and all other data displays and graphs show all data for the day and days before and to date, after …???
John Y
have you not read this Weather Display Support
Attached id screen shot of rainfall for Feb 2022…
As can be seen on the blue ‘rain to date’ section, ONLY rain is for 2 mm on 7th.
This is the correct amount…
The 'detailed rain chart show ‘0.0’ mm for 7th, BUT 4.0 for total for month, and the main screen section bottom right show ‘4.0’ mm …
ALL attempts to correct this through “normal” methods has failed.
This is the ONLY rain that has fallen this year to date.
If Brian is not available and some one can tell me how to fix this, I would be VERY gratefull, as this rainfall problem needs to be sorted …
Version of Weather Display: v10.37S Build 134
Operating system: Windows 11 Home 64 bit
Weather station hardware: Davis VP2+
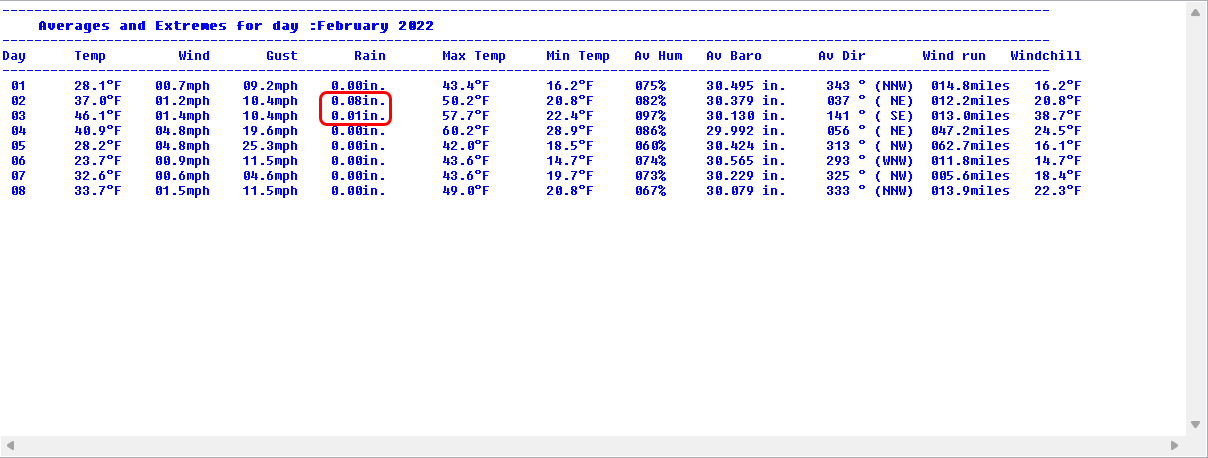
I’m having the same issue. Throughout January the rainfall and/or other data would randomly stop updating and I fixed it every few days using the process below. For some reason it would often fall back to December data. I last fixed the data on January 28, and I closed out the month with no errors and rainfall totals for each day, the month and the year were correct. February started off fine, but the issue has resurfaced. I’ve had two days with measurable rain in February: 0.49" on the 3rd and 0.37 on the 4th for a monthly total of 0.86". My 22022lg.txt file is correct (I just ran it through Stuart’s WD Log Checker). However, looking at the February Averages/Extremes in WD (see screen capture), rainfall is recorded as 0.08" and 0.01" on the 2nd and 3rd. I can likely fix it (again), but it would be nice to find the root cause for why the rainfall is randomly changing.
Action → Convert Logfile(s) Data Files (Reset Graphs), and then the current logfile will be shown, click Convert
Go to View → Averages/Extremes NOAA Style Reports
Recreate the reports for the month by selecting the tab Averages/Extremes
Select the date to calculate and click Update whole month
And, WD is correctly sending the data to WU, CWOP, and PWS:
http://www.findu.com/cgi-bin/wxpage.cgi?call=FW2194&last=240
https://www.pwsweather.com/station/pws/KVAALDIE28?timespan=month&date=2022-02-09
Yet again the rain has not been recorded correctly …
0.2 mm @ 9am this morning is shown on rainfall section of main screen, and reported correctly in ‘Month to date’.
The rain to date ‘Last 7 Day’s Rainfall’ displays 0.2 mm on todays date.
The ‘Detailed Rain Chart’ displays 0.0 recorded for today, BUT the total section DOES record the 0.2 in the total amount for the month ??
I am sorry to be a pain in the but on this but it has been going on for a long time and appears to be problem that keeps falling between the cracks…
Rainfall is a critical element in weather records, and if it not recorded correctly, it corrupts the data set.
( As a retired Bureau of Met weather officer, I like to see and record the correct data )
As of this morning, all my rain data for February is correct. I installed the latest version of WD, Build 137, yesterday and that seems to have self-corrected my rain issues. But as you say, this has been going on for a long time, so we’ll see if this fix holds. The rain is a critical element, especially if your data is being sent to Weather Underground and/or CWOP because the data then goes into the NOAA/NWS MADIS system that is assimilated into the weather forecast models. It also becomes part of the climate data record.
As Novawx has stated, and I indicated in previous post , rainfall data is critical to all weather reporting/ forecasting and climate data. And as before the program has failed to display this months readings in ‘Detailed Rain Chart’, and no matter what I do I can not get it to do so.
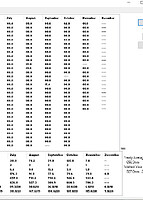
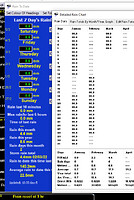
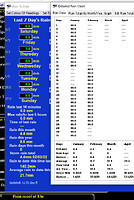
AS can be seen in attachment the rain for March to date is recorded in 7 day screen correctly and so is monthly total. However, the ‘detailed rain chart’ shows ‘0.0’ for both 2nd and 3rd BUT monthly total is correct.
The dashed lines for Jan and Feb are missing / failed attempts to correct rainfall which has in some cases corrupted the data altogether…
The program does NOT indicate if an action has been completed correctly when any corrections are made or when for example a ‘Saved’ action is completed, (with only one exception I have seen). This to me is a great failing of the program, and there is not a complete DETAILED instruction manual. I have seen and carried out the you tube based “instructions”, with little success, all this has done is to corrupt data further.
I have installed the current version of program, as novawx suggested, with NO improvement to problem.
I hate being too critical of the program, but if a problem can not be resolved when others have similar problems with a part of it, then I think some is deserved. I have offered to assist with solving this in the past.
After posting previous post, I re opened the rainfall windows and screen shot below is what is now showing for March rainfall …
Need I say more …!!!
I agree with Ex-Whr. I to have posted my similar rainfall problems in the past. I updated to version 134 and my detailed rain chart was corrupted with no rainfall at all showing, so reverted back to v131 and there are minor issues but at least its showing data.
WD is a great program, but rainfall is a major reading in collecting weather data particularly now climate change is with us.
Have a good day
