Hi
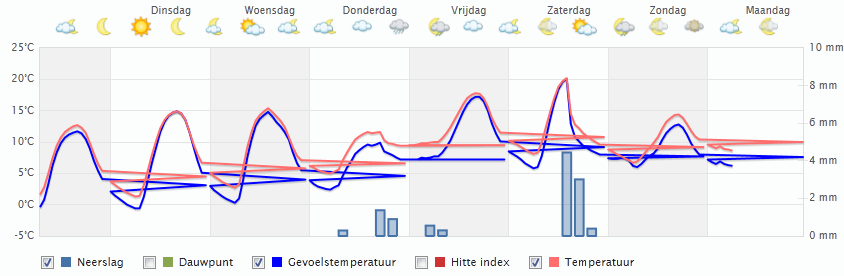
Yesterday in WxSimate, WXSIM and Wret the DTS checked. Since then I have a broken temperature curve in my latest.bmp.
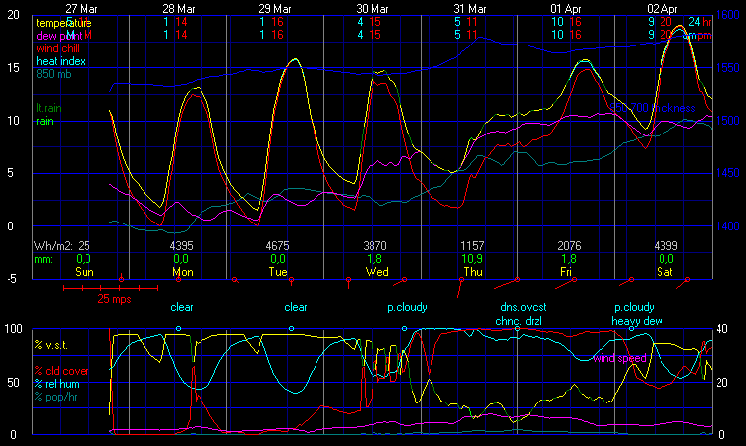
There are also odd spikes in my 3in1 graphic.
Can anyone tell me what’s happened. Thanks in advance.
Regards,
JanvR
Hi
Yesterday in WxSimate, WXSIM and Wret the DTS checked. Since then I have a broken temperature curve in my latest.bmp.
There are also odd spikes in my 3in1 graphic.
Can anyone tell me what’s happened. Thanks in advance.
Regards,
JanvR
It doesn’t look like there’s anything wrong with your latest.bmp, the yellow temp curve has green gaps in it but this is normal as I think it shows either light rain or the heat index, I can’t remember which.
As for the meteogram, are you using the latest version of this? I know I’m not and my temp graph looks the same (intend updating it today ![]() ).
).
There were some things that changed with the latest update of WXSim that required some changes in the 3in1 script, especially if you use the soil forecasts.
Martin.
I’m also using 3in1 script and it works as it should even after DST. But if I remember correctly, I had the same issue with an old version of the script but when the month changed it also fixed the graph. So I recommend that you wait a couple of days or just download the latest version of the script.
Reko
Updating to the latest version of the 3in1 script sorted the graphs in my case. ![]()
Thanks for your reply.
First of all I will wait to the end of this month. The WxSimforecast looks also good without errors.
When I’ve more time I will update the 3in1 script to the newest version.
Regards
Jan
Nothing in WXSIM has changed in many years with regard to the handling of DST (which actually requires a rather lengthy explanantion - for now I’ll just say I’ve put a lot of thought into this rather difficult to handle issue). This is a matter of how the script interprets WXSIM’s output data.
Hope that helps! ![]()
Tom
Hi Martin,
It could even better…
It has to be jquiry.ui.css instead of jquiry.ui.1.8.1.css or something.
It has to be changed also in the Sivu2 file.
Look at my Meteogram: http://www.weerstation-marsdijk.nl/assen.php
Oebel
Hi Oebel,
I think you were looking at my test page (wx3in1.php), I’m using the jquery.ui.css in my normal forecast page. ![]()
I’ve noticed a couple of things with it but I’ll put those in the 3in1 thread.
Martin.
Hi Martin,
Ok
Thanks,
I’ll look into it, I noticed the wind arrows and the thunder graph, I also noticed that there’s a slight miss-alignment with the table on my page. The background it OK but the inner table is a little too far to the right. The other thing was the lack of UV images on the Detailed Forecast page, but Henkka is missing those as well.
Better swap this one over to the 3in1 thread now anyway. ![]()
Martin.