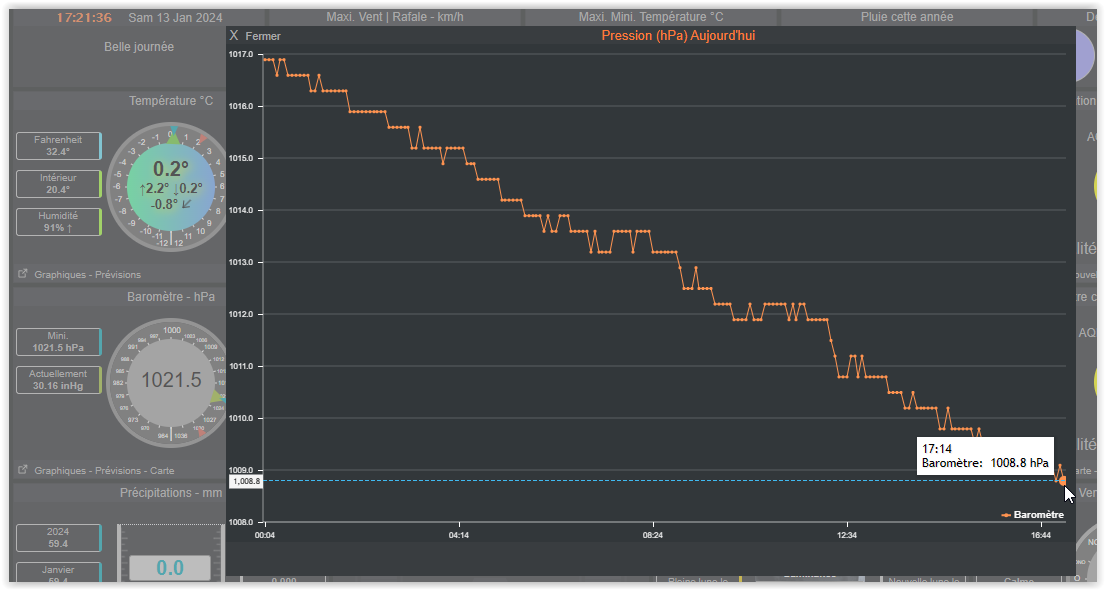
I have difference between the current value and the graph . Why?
Can we have the URL of your dashboard?
That would help a great deal so we can see and perhaps check
Hi on4rm,
The graph data is downloaded from WU directly.
Your WeatherUnderground page has the same values as the graphs
The data on the dashboard is uploaded by WEEWX in the realtime.txt file
Your other WEEWX website also has the 1021.x values
Your nearby METAR (EBBR) currently also rteads 1021.x values
If pressure values are that different as on your website, they are probably using sea level pressure for the website realtime.txt file and station-pressure for upload to WU.
“Sea level pressure is always higher than station pressure –unless your barometer happened to be located below mean sea level”
Question:
What is the console of your station showing? → screenshot?
Wim
Nice answer. Ok I’ll check.
Also in your settings the start-date for WU has a typo.
That is why the selectors for day, month, year a.s.o. below the graph are missing
Testing the graphs with
https://www.on4rm.be/pwsWD/_test.php?test=PWS_graph_xx.php
returns an error on that date setting.
Please check tab Api&Keys
→ WeatherUnderground: weather-data - forecast - historical data
- → First day of uploading correct data to WU
Format is YYYY-MM-DD example 2018-11-24
Regards,
Wim
I don’t understand this last answer. I’ve checked in and it’s correct YYYY-MM-DD
Ok I have understood your anwser. ![]()
Yes, the graphs look OK now ![]()
P.S. Wim is on holiday this week: https://discourse2.weather-watch.com/t/i-am-on-vacation-so-less-support-from-my-side/73152?u=bitsostring