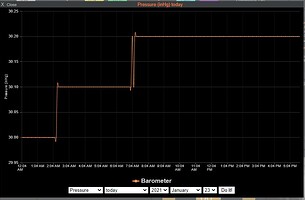
The chart for barometric pressure chart when using inches needs 2 decimals, not just 1.
Thanks for spotting this. A leftover in the MITM script from the time when there were no decimals or only 1 for inches .
Will be included in the next update.
Be aware: only new data will have two decimals for inches.
So “todays graphs” after at least one hour. Period graphs only for the new days.
It will cost a lot of API calls to reload all yearly data.
Plus for the period graphs with only two values / day, it does not make a big difference in the graphs.
This attached version for you to test.
Wim
PWS_DailyHistory.php.zip (8.08 KB)
Actually, the historical files all display properly.
Only since I installed the template on Jan 8 are the charts wonky.
Is there a way to easily get the data stored on WU for Jan 8th to Jan 24th? It would be worth the calls for me.
I have installed the test file and will see what happens, but I am confident it will work.
Tom
Rename the wudata/XXXXXXXXXX-metric-2021.arr to XXXXXXXXXX-metric-2021.arrold
The new array for this year will be generated. That is only 25 days.
Will not cost more then 2 API-calls
Wim
