Possible problem with Convert Log Files to Graphs

,

Hello there,

I have two issues related to data logger and build 10.37 of WD.

I am running 10.37 WD on an Athlon 2100XP with Windows XP Pro and service pack 2 and 1 GB of memory. My weather station is a La Crosse 2317EL.

Issue #1
I recently ran into a problem when restarting WD where I set the time for data logger to begin retrieving data to the wrong time. That is to say, last night when I was restarting WD around 9:23 PM local time, I had accidentally set the time for data logger to begin retrieving data at 8:15 PM (I was using 24 hour time and got confused thinking hour 20 was 9pm - which obviously it is not). When the program restarted, it collected data that I already had from 8:15 to 9:27. This showed up subsequently in the graphs. Note this was for 31MAR07 and of course we are now in April. I don’t know if that contributed to the problem of not being able to clean up the graphs or not.

Ok, to resolve the problem, I edited the 32007lg.txt file and deleted the erroneous 8 PM data rows so that the data transitioned smoothly from 9:23 PM to 9:24 PM. That was all fine. I saved the file and used the Action->Convert Log Files to Graphs function to fix the problem.

I read somewhere in these forums that the Convert Log Files to Graphs does not fix graphs < 24 hours. Ok, but I find that my graphs that are 48 hours, 72 hours, etc are also still showing the 8pm data between 9:23 PM and 9:24 PM. So, even though the log file looks fine now, the graphs persist in showing the extra data between 9:23 PM and 9:24 PM (that data being for the 8pm hour).

Anyone know what I’m doing wrong or how to fix this?

Issue #2 - if, when I restart WD, I decide not to let data logger complete its data collection (I have it turned on in the control panel), and I press the ABORT button, I get an exception from WD 10.37! That is to say, some portion of the program aborts. I am guessing it is multi-threaded so the process that handles the data logger retrieval of data is not the same process that displays your control panel normally. However, when this program abort occurs, it ties up my system royal. I can either wait a long time to get a response from the task manager so I can abort the program (a long time) or I can reboot my computer.

If instead of hitting the abort button, I just click on the to close the window for data logger, I can terminate the data logger without ill effects. But if I hit the abort button, I really mess up my system and WD.

Anyone else experience this just as they restart the program with data logger enabled and they hit the abort button?

Thanks - Jerry
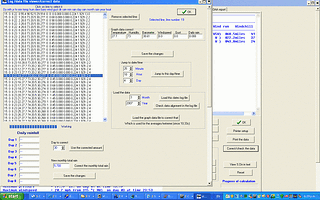
after converting the logfile to data file you then need to click on recreate last 31 days data file
i will check out the abort button

Hi Brian,

I did also press the “recreate last 31 days” too but it didn’t seem to resolve the problem.

Any other tips are most welcome.

Thanks Brian!

Jerry

zip and email me your logfiles 32007lg.txt and 42007lg.txt
also have you checked on the data alignment of the logfiles under view , averages/extremes, check the data?

Hi Brian,

Well, I tried as you suggested the data alignment check and I have a question about that. If I load the March 07 data and click on a row of data after I load the file, most of the data from that row does not show up in the “Graph data correct” window even though I can see it in the log file that was loaded. The only thing that shows up in that window is the temperature and it isn’t correct.

Also, if I click on “check data alignment in the log file” it seems to process the file but I end up with only about the first 5 columns (day, mo, yr, hr, min) of data showing and the other columns are missing afterwards.

I will zip up the files for you and a picture of what I am describing above. Thanks for any help/tips.

Jerry

zip and email me the logfile and i will have a look

Hi Brian and thanks for the help - I have mailed these items to you.

Jerry

one thing to note:
after loading the logfile to check on data alignment, then the click on the line does not work for that data

i have you data:
it works here, but first i went, action, convert wd logfiles to graphs, selected 32007lg.txt and then clicked on convert


Thank you for the reply Brian.

I have two questions related to this:

  1. If I bring up the “Correct/Check the data” window and all I do is click the “Load this dates log file” (after selecting the month of 3/2007), the data loads into the window properly but then when I “click on a line to select it”, the corresponding data does not show up in the editing window “Selected line”. All I see is a temperature of 32.0 and the rest of the values are zero even though there is data plainly present for most all columns in the window that shows all the log data. This is true for 3/2007 and 4/2007.

  2. When I bring up the “Correct/Check the data” window, select 3/2007 and simply press “Check data alignment in the log file”, it seems to go through some checking process but I am not sure of the results. What should I be looking for if it finds a problem? Is it going to put a message in the log display window that says there is an alignment error?

Also, I don’t seem to have a way to view my original problem now that the data has advanced onward which was that after I edit the log file for March manually and then convert the wd logfiles to graphs (as you mentioned in your last reply note), the graph still showed a problem with the data for the period from 3/31 at around 2123 to 3/31 at around 2124. If I scrolled the graph across this time, I would see the graph increment up from 2100 hours to 2123 and the data would increment in the graph correctly. However right after that, it would show data from hour 2000 for several pieces of data and then as I kept scrolling to the right it would jump back to the correct time of 2124 and continue on. So, in summary, there appeared to still be data from hour 2000 in the 2100 data (even though I had removed that data out of the logfile).

I think at this point we can drop this issue because I no longer have a way to go back and view that data for the period described above due to the collection of new data since then. I’ll just keep an eye on it in the future and if I see it happen again, I’ll let you know.

Thanks again,

Jerry

the line to view only works from the load the data file, not the log file

for the alignment, if the date/time suddenly goes wrong in the list, you know that is where to look for problems with the data alignment in the logfile

Brian,

I am very confused about how to get the graphs in the main WD display screen to show the changes I make to my data file when I run into a problem. Here is what I tried…

Due to restarting the WD program tonight, I ended up with records that went in a sequence from 19:05 to 20:50 and then 19:06 in my 42007lg.txt file. That is to say, I had one erroneous record in the file (20:50) - it was out of place and needed to be moved. I ran the

Hi,
Did this problem manage to get fixed as i’m finding myself in a very similar situation? Although i’ve followed all of Windy’s and other’s suggestions, there is still a problem with the fact that the graphs aren’t showing the changes that have been made to the log file.
I’m using an Irox Pro station with a vista machine, currently using build 10.37g.
Any more advice would be appreciated
Cheers
Henry

try checking the alignment of the data in the logfile, via view, averages/extremes , correct/check the data, load the logfile then check the alignment of the log file
but note that WD does not use the logfile ,it uses the data file, and so any changes to the logfile, you then need to go action, convert wd logfile to data file

Brian,

I have an issue (bug tracker #0543) that is related to recreating the graphs that I believe was the result of the new routine you created to marry the 2 log files together.

The problem is the solar data in the newly created graphs is totally wrong. The other data I fix gets recreated properly, i.e. temperature, wind, direction, etc. so I don’t think I have the exact problem listed here.