Good afternoon
Is there a way to put graphs on the personal air quality meter. Unfortunately in my village they want to build a factory that pollutes the nature a lot. It would be a great help to us.
I have a wh41 sensor (pm2.5) I know it is not very reliable but it gives a reference.
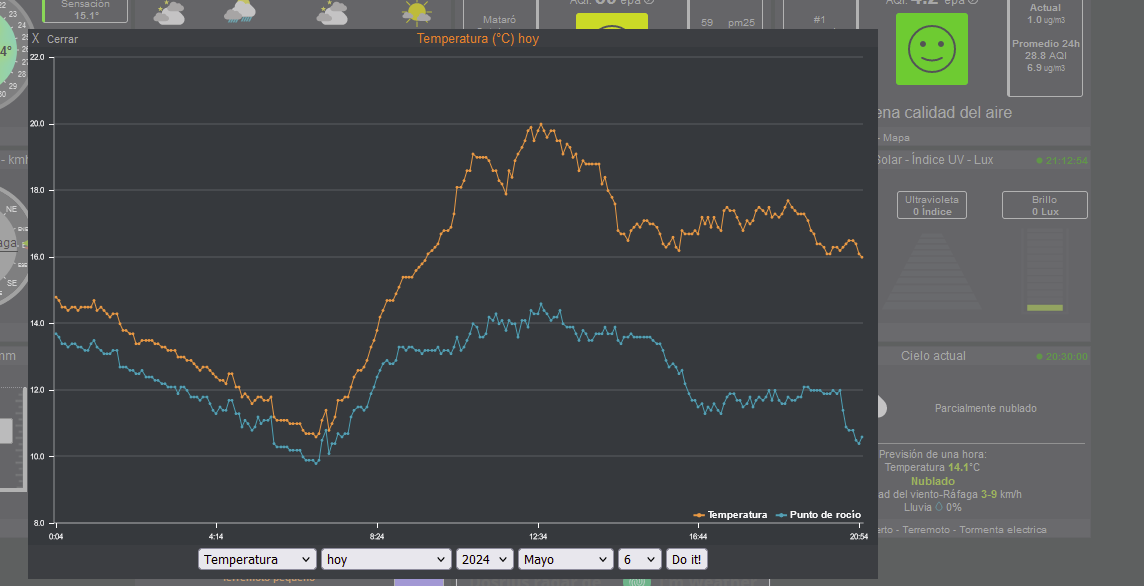
I added Weather Display’s graph for my PurpleAir sensor as a popup.
-
Upload the graph (mine is called aqichart.gif) regularly to your server root.
-
Add an entry to image_popup.php:
- Add a popup to your AQ block in PWS_blocks.php:
You seem to be using WU charts in PWS dashboard, but I don’t think you can get AQI charts from them.
Can you not generate charts in Cumulus and upload them?
You are right. The graphs are from WU data.
How do you generate the graphs with Cumulus?
Only from air quality in JPG or GIF format.
I’m sorry, I don’t know much about Cumulus - I was just asking if you could ![]()
Ohh. Thanks anyway
See if a colleague knows or has an idea.