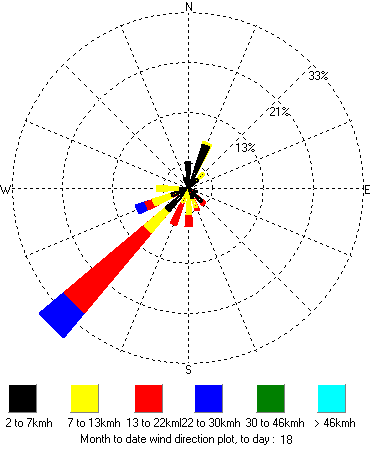
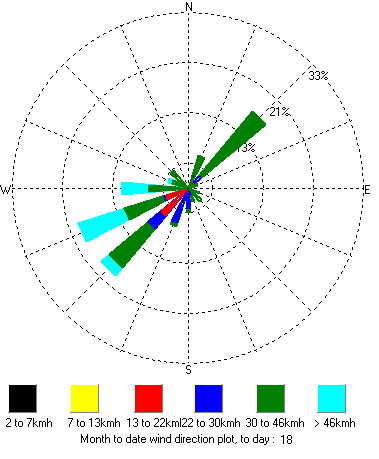
ah, ,…the number is ok,but the units should be kmh instead of mph for those last 3 numbers on the legend (i missed converting when using copy /paste)
i will get an update uploaded
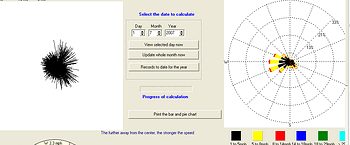
I kind of like it. The “old” one to the left… on mine at least shows only the spread of the plot here is part of the screen as I see it …

wow
you sure are not getting much wind (and then what wind is from all directions)
i have updated the .zip version again…labels in the wrong place on the web image…and I added a create web image now button…and I fixed the decreasing scale bug when you go back and view that tab again
no wind right now , generally get the evening breezes as the air cools, but not tonight.
that looks more interesting ![]()
you can select just a day from any month /year , too, or any total month, or even year , etc, to check out past plots
(there is still an occasional glitch I need to find where sometimes the fill colour colour in the whole thing, or does not colour in)
It seems that no matter what day I choose, the only thing that updates is the green wind chart on the top left.
The strip across the top and both the scatter charts don’t change at all.
working OK here , just tested, latest update, when I click on view selected day now (for this month or last month selection)
Cool, it’s working now via a custom screen. ![]()

Mine is also working fine and like a few others not much to see as the wind isn’t that strong most of the time. One question. What are the 13%, 21% and 33% representing? I did find a day where the numbers automatically changed but assumed that was wind speed. The % is what I don’t understand. Maybe the percent of time from that direction??
–Dave
Maybe the percent of time from that direction??correct :wink:
Foggy, there is the windrose.gif image crearted and uploaded auto daily (if you have the detailed climate report/noaa report uploading too)
so no need to use a custom screen I would have thought? (unless you want to add more text about what it actualy represents, that is!)
This new wind rose will be more usefull for people that get alot of wind from a small range of direction (i.e where you have a strong predominant wind). The gem is that it shows the individual speed components for each direction (great for wind energy analysis)
I am going to get in trouble for this :? but I cannot resist…
one would think with all the politicals ( Obama, Clinton…) in the state we would have a lot more winds blowing… ![]()
But Aardvark - they are all blowing from different directions cancelling themselves out huh?
I have seen some high average winds in DSM, like over 20mph all day and from one direction - like south in summer daytime and northwest in winter… are you quite sheltered there in your southern part of town? Or has the weather been particularly calm with all this heat in the last two weeks?
Not sure what the issue was last night, but today, when I change the date, I get different results as I would expect.
We have had some decent wind coming from the same direction the last two days so it shows up better.
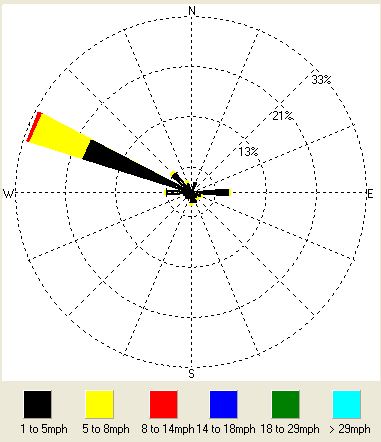
yesterday must have been more scattered because we had more wind, but apparently not from the same direction.
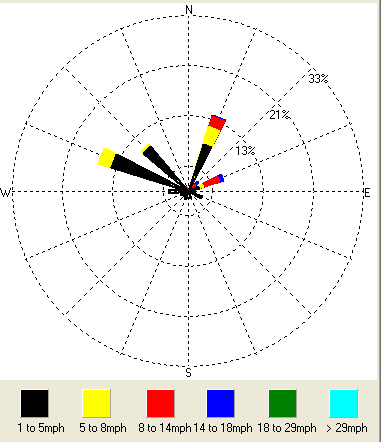
nice ![]()
i see i have to shift one of the labels left a bit for when kmh in use ![]()
Or just put the units above the Black block and leave the numbers intact without the units…
Hello Brian,
Do you think it is possible to add the possibility of how much energy (computer calculated) in watts it would be if there was a wind generator?
Thank’s Angelos
there is the wind energy (hours at each windspeed)…have you seen that?
Hello Brian,
Sorry
To tell you the truth i saw that once at the beginning and forgot it :oops: Now i saw it again and there are information’s to help someone who want to put a wind generator. Do you thing it could help more if on the same template were something like energy in watts too ? ![]()
Angelos
PS: I thing i have to stop writing my name every time. (Keep the post sort and clear). The name is anyway written on the left
