Firstly, Happy New Year, secondly, big thanks to creator of PWS and all the great information. I do have a technical background but setup was nice and easy, running with my Ecowitt WS90 and GW2000. Of course I have some questions
The PWS Dashboard has only been running since 31st December with associated cronjob executing every 5 minutes, so technically only one midnight rollover, my history file is updating as expected, rain for yesterday is showing OK. Would it be expected for the max/min temp and wind to update after the second midnight rollover, in other words by 2nd January? currently they are essentially showing max/min from today only, rather than listing higher wind gust from yesterday (31st) for example.
One other thing I noticed, the temperature trend doesn’t display from my Ecowitt, is that an error on my part I wonder, seem to think someone was showing that in a screenshot from some months ago. Battery voltage would also be nice if I can make that display, not researched that just yet, will do today if I get chance.
Thanks again for creating this, should be very useful.
As you can understand, nobody is clairvoyant on this forum.
@ALLAlways add the link to your website
Answering is often impossible without checking the website and the weather-data
or
Answering with the URL costs extra time as multiple answers are possible for the same problem.
Some questions you posted I can try answer without visiting your website:
=> The temp-trend is not in the ecowitt upload as long as you use custom upload to your website. Nor it is calculated and stored in the history file.
==> Check . . ./pwsWD/PWS_module_test.php middle and right button bottom row, temp_trend = n/a
=> The small blocks show this-year high-lows
==> So they show todays data (as it is January 1, 2023) in all three rows.
======
After your PM I cxould check your site. You are loading data from 2 files.
Please enter in easyweather as the location of the standard upload ecowitt file ./ecowitt/ecco_lcl.arr
All scripts are run relative to the main dashboard folder pwsWD/ in your case.
Do not add …/pwsWD/ , it can give conflicts later
You probably entered an extra sensor file file-location also, that is not needed in your case.
Thanks, modifications made, lets see how it goes now.
Will report back in due course, appreciate the other info also Was contemplating uploading to WU but decided to try the Ecowitt direct upload for now, early days for me, so far though I like it a lot, great work and fantastic support, very kind and hope you are well there. Wondering if there is any great benefits from using WU, I like having control on my own site to some degree but missing out on some data feeds could be a down side.
Re the min/max I could have sworn I saw someone with last years high or low mixed with this years, that could have been something they coded in though! last day of the year was not ideal for me to start on :lol:
Upload:
You should always upload to WU. That is a no-brainer.
They store your data “forever” and you can re-read the data any time.
Also you get a nice forecast with textual weather-descriptions.
Your station data on the dashboard:
You should not use WU for populating the dashboard.
Using Ecowitt is faster and easier.
Ecowitt allows more granular data, you can instruct your GW2000 to upload every minute.
When using WU you are stuck to 5 minute data which is always at least 5 minutes old.
BTW, your GWxxxx or console can upload to 4 sites simultaneously.
Ecowitt, WC, WU and one free choice.
You should always upload to Ecowitt and WU. => both (for now only WU) can be used as data-sources for your website also.
You can use custom upload to populate your website.
You can use the “upload to others” feature to upload the data from the dashboard to other webservers s.a. Awekas or PWS_weather.
Or use @olicat’s tool the do a lot more with your ecowitt data.
Graph data:
You should use WU for that. That is also a no-brainer.
Simple reason: the graph-scripts are far better when using WU data.
The other option is using the cron-job to update a graph data files every 5 minutes.
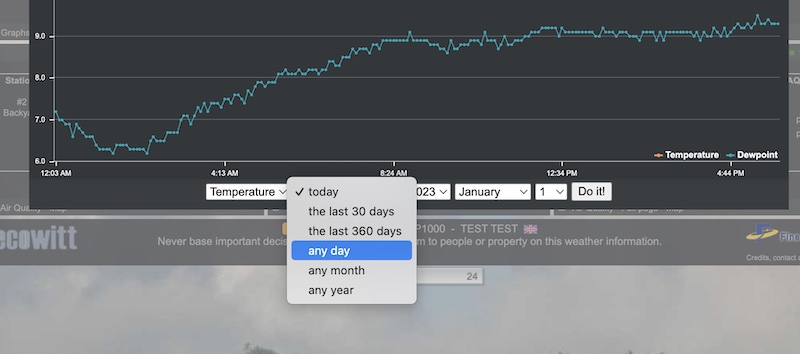
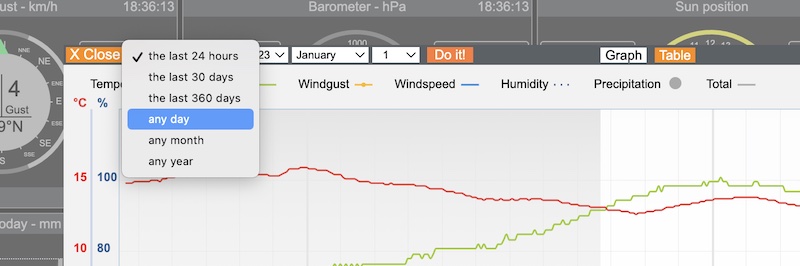
See attached screenshot.
The first 3 choices are valid both with WU and using the “cron_generated” data.
And only with WU-data the other 3 choices are available and allow you to generate a graph from any day, any month, any year.
The upcoming release has for the WU-data only a new engine: a more modern graph, with selectable weather- values, periods, screenshots and export data.
And it also adds an extra tab with the detailed data where you can sort the data on any item.
So when not using WU from the start as your “extra_database” , you will probably loose a lot of nice features.
Thank you so much Wim, fantastic mine of information there, I have setup WU already and will pull the graph data from there going forward. I am pushing data from the GW2000 to my website every 30 seconds which is a bit overkill but anyway. Now have data being sent to Ecowitt.net, PWS and WU from the GW2000. Hope to get a WH32EP sensor added this week, should help the temperature data accuracy.
Once again a big thank you for all this help on new years day no less =D>
It is a shame, the update rate for wind gusts on WU is incredibly quick, not sure how it is so quick actually, when wind is above 5mph it almost seems to update as quick or quicker than the Ecowitt GW2000 hub!
Update rate isn’t the end of the world, just when the wind is really blowing it is sometimes nice to see the gust speed close to real time. Working on lowering time intervals for uploads from the GW2000 to my own site without causing any issues and simulating an attack!
8O If anyone knows the minimum ‘donation’ amount that will not be refunded, I would be all ears
One 10 euro donation every month, would be a pretty healthy 120 euros subscription per year. That sounds like good business to me, not money I would turn down.