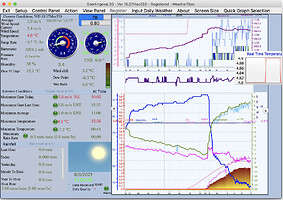
I’ve been running WD Ver 10.37/Mac 359 for around a week now, and generally enjoying the experience very much, albeit it is a steep learning curve. I have it set up on a 2018 iMac running Mac OS 10.15.7 (Catalina).
I’m using data from a WeatherFlow Tempest (but I also have access to a NetAtmo set-up, the data from which which I can also access via WD, and a “Ventus” unit - which I haven’t tried yet, which is why I have not bothered to find out the equivalent model in WD).
I have been trying to get the main screen of WD set up how I would like (before I start experimenting with web unploads etc.), and have nearly got there, but there are a few things that I haven’t been able to achieve, and which probably reflect my ignorance, but may reflect bugs. These are mostly annoyances rather than anything serious, and I may well have overlooked some settings, but these are somewhat overwhelming ![]() Please see the attached screen-shot for the current state of my main screen.
Please see the attached screen-shot for the current state of my main screen.
-
Several text items are cut off - in the default layout, for example, the end of “Quick graph selection” goes beyond the right hand border of the window. In my current layout, the legends for the wind/pressure graphic area collide with the border and are not correctly aligned with each other. There were also several other issues like this that were solved by choosing an alternative (and narrower) front and smaller font size for all the text fields where this option seemed to be available. The menu fonts and graph label fonts don’t seem to be definable in any settings that I can find - so maybe WD is looking for a default font that I don’t have and substituting a Mac default font with different spacing?
-
Although I can (sometimes) set the wind direction dial outer font colour to something other than bright green, it always reverts to this colour on next restart - and the time is always given in bright green without any apparent option to change this colour (or font). Note that the application of my chosen font to the wind dial cardinal direction text is inconsistent.
-
If real time temperature and wind direction graphs are enabled, they are always anchored to just beyond the right hand side of the screen, and don’t seem to be moveable.
-
The procedure for customizing the main display only seems to partially work:
a) I don’t seem to be able to move text labels (see the position of the labels for the temp/humidity/wind direction graphs).
b) The behaviour when re-sizing the graphs is not what I would expect: shift-clicking and dragging a graph depends on where within the graph one clicks, and I can only increase sizes never decrease them (unless I release the mouse and click again). I suspect this (and maybe 1 above too) may be related to the “retina” display of the iMac (which is shred by all current macs with a screen), as it looks as though the selected object/area is half the size of the displayed object/area. -
I would like to alter the y-axis of the solar graphs so that the data display is much larger - ideally with the max solar radiation at midday being close to 100% of the graph height - but there don’t seem to be any controls for the solar radiation axis, except to plot it at half scale, which is not the direction I want to go (UV, however can be adjusted). Maybe this is also a retina display issue, as the maximum radiation at midday is approximately half as high on the graph as I would like it to be.
I hope you will forgive me if these issues are already answered elsewhere in the forum, and that someone can point me in the right direction if so.
Cheers
David
