hello
I am testing the new version and noted that steelseries works with clientraw
customclientraw could run as in version 2.6
thanks
emilio
Hola
estoy probando la nueva version y observo que steelseries funciona con clientraw
podria funcionar con customclientraw como en la version 2.6
gracias
emilio
I do not understand your question. so let me explain.
If you are testing the version 2.7 there are only two (2) files to upload for ALL realtime files.
If clientraw is supported by the weatherprogram => clientraw is used
Why clientraw: As that is used in most cases by other scripts such as WD-Live.
If http upload is supported (meteobridge) => http is used as http upload uses far less resources compared to ftp.
Others use either a special format (weatherlink), or use the already available “Steelseries” realtime file.
Why Steelseries: that file is for most new template users already available.
But always only 1 tags file with 5 minute data and 1 realtime file as fast as 10 seconds depending on Weather-Program.
===
If this does not answer your question, please tell me what you want to accomplish,
Hi Wim
on the steelgauges live page on version 2.7 the temperature and dew point gauges when hovered over only show text with a little box with a “X” in where the graph should be is that correct or should there be a graph, I also just checked version 2.6g and the gauges show the same, all the other gauges show graphs on both versions
Hi Wim
it is only on the main site that those graphs are not creating they are created on the test site ok have included links to both main site templates and test 2.7 template
I think there is a permissions problem with those two graphs.
Executing the scripts from the browser gives a 404 error same as in the Steelseries page as they are loaded that way.
Loading them in a script to display the souyrces gives a 500 ineternal server error.
Please check those two scripts using your FTP program and give them the same permissions as the others.
weather2 at http://www.hc-iom.co.uk/
=========================
Failed to load resource: the server responded with a status of 404 (Not Found)
http://www.hc-iom.co.uk/weather2/wxgraphs/temp+hum_24hr.php?lang=en
http://www.hc-iom.co.uk/weather2/wxgraphs/temp+dew+hum_1hr.php?lang=en

weather27 at http://www.hc-iom.co.uk/
=========================
Failed to load resource: the server responded with a status of 404 (Not Found)
http://www.hc-iom.co.uk/weather27/wxgraphs/temp+hum_24hr.php?lang=en&wp=WD
http://www.hc-iom.co.uk/weather27/wxgraphs/temp+dew+hum_1hr.php?lang=en&wp=WD

ALL OK AT /ballaugh.no-ip.biz:2081/
=========================
Hi Wim
I notice that those files have a “+” in there file names and my web host may not like them, to test this I would like to change the
temp+hum_24hr.php to temp_hum_24hr.php but not sure which other files I need to change the ref to in
I have just uploaded file named temp_hum_24hr.php to the main site weather27/wxgraph folder and did a direct read and got a graph this confirms my host does not like “+” in the file names
Very good find “detective” Harold,
Just curious, which platform your webserver is on, Linux or Windows? I bet Windows then.
OK, the graph definitions are in weatherXX/gauges/scripts/wsGauges.js approx. lines 84-96.
Those two scripts are mentioned multiple times, so check carefully.
Succes, Wim
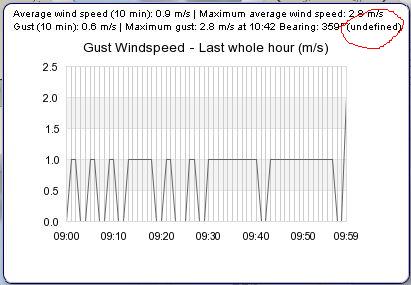
What does the (undefined) in the Wind graphs mean, it’s also on the demo site?
screenshots “Wind.jpg” and “Windd.jpg” - red circle
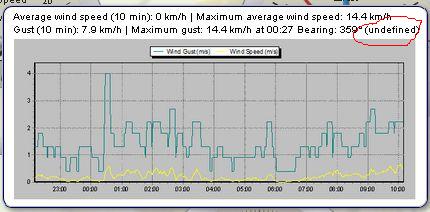
How to make the graphs look like on the demo site? I mean especially the small frame with the line description.
screenshot “Windd.jpg” - Wind Gust (m/s), Wind Speed (m/s)
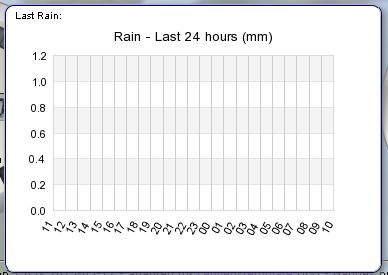
Rain graph - in the header there is nothing after the “Last rain:” text. On the demo site there is a date and time. Is it because I use dd.mm.yyyy date format?
screenshot Rain.jpg
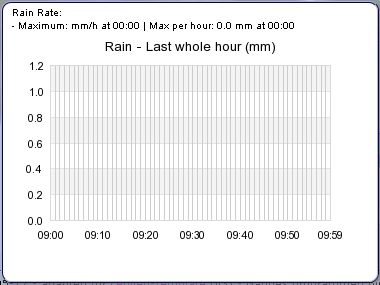
Rain Rate Graph - in the header there, there was: “Rain Rate: - Maximum mm/h at 00:00, Max per hour: 0.0 mm at 00:00” even when it was raining and the graph showed some peaks?
screenshot Rainrate.jpg
You are mixing and matching output from different weather-programs.
3 of the graphs are from a weather-rpogram supplying graphs via clientraw, the different one is from cumulus.
When mentioning " it’s also on the demo site? " PLEASE be specific: There are three sites and those three are supporting 11 weather-programs.
You can select region and weatherprogram in the yellow box at the top.
Q1: What does the (undefined) in the Wind graphs mean
A1: No idea yet, the wind direction should have been correct
Q2: How to make the graphs look like on the demo site?
A2: Use cumulus (just joking) or define nice graphs using Meteohub. They can be extremely nice. Then we could use those graphs.
Q3: Rain graph - in the header there is nothing after the "Last rain:
A3: Meteohub has no last-rain tag, so it is not available for meteohub.
Q4: Maximum mm/h at 00:00, Max per hour: 0.0 mm at 00:00"
A4: In a next maintenance version those will be spaces also when the weather-program does not supplies the data
We have to compromise between what we want (a lot) and what a specific weatherprogram not being Cumulus supplies.
The Steelseries are originally developed for Cumulus in stand-alone page mode.
With the Leuven-Template they are now supported for 12 wetherprograms in full page and different small dashboard versions.
But it is impossible to make every weatherprogram a cumulus clone.
And the Leuven-Template is a starting point to build your own site.
Feel free to change/improve any script and share those improvements with others.
I’ve looked at the Weather program support table before and I took from it, graphs are supported from Clientraw for Meteohub.
I didn’t know, it means some limitations. Now I know.
I’ll look into the possibility to use Meteohub graphs instead.
I hope it’s not above my “skills”.
Thank you very much for the great template, your support and development, it allows people without programming/coding skills (like me), to have a nice weather website.
My weather website before discovering your template was only a simple WDL page http://rosa.mywia.cz/
This is normal. The script will test the 4 clientraw files against the last known version for those files. And Meteohub does not supplies those latest added fields yet. So if you are developing a script to use a clientraw file you have to cope with it. But this is strictly developer information and the menu will be not shown if debug is switched off
I don’t know, if it causes any problem, just reporting it …
Thanks for reporting these things, they are needed to improve the template,
Hi Wim
my web host is windows server 2008 I believe
have updated the file names and amended the wsGauges.js file then tested after a cache refresh all ok on both
have zipped and attached the amended files for anyone who has a similar problem and can be used in future updates if you require.
can you tell me where the yellow box that hits the top is disabled
This website is under construction - Deze website is in opbouw - Ce site est en construction - Diese Website ist im Aufbau.
Please return later. Schauen Sie bitte sp