Hi Tom,
Just some feedback on where my learned bias corrections (WXSIM-Lite Percent Influence) is at.
Since the new features where implemented, in my case started on the 23rd Feb 2016, at which point the percent influence dropped to 49.9% and continued to fluctuate up and down for ages.
The lowest being 46.7%, as you suggested ages ago, it finally started to climb and has now been on a steady increase since 23rd Jul 2016.
It is now at 61.5% and nearing my initial Target set in WXSIM of 63% (note: originally prior to the new upgrade it was 70%) hence the graphs below showing 70% a year ago same time. .
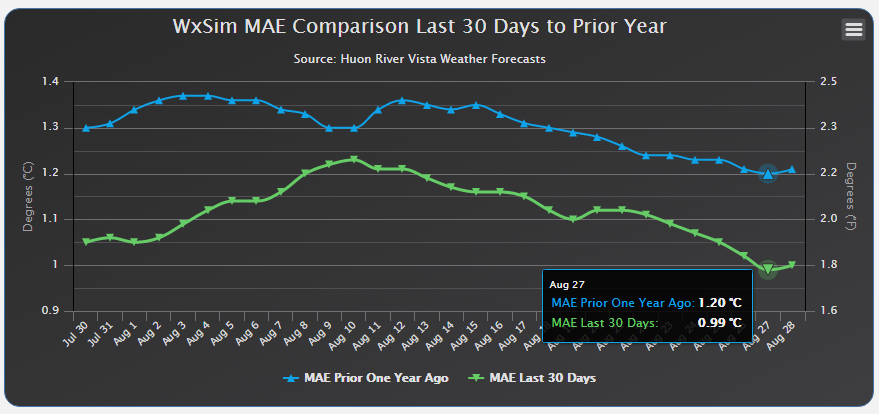
Also with ref to an earlier un-answered post I made back on the 28th Aug 2016 regards my “MAE” record low of 0.99 c" see below;
http://discourse.weather-watch.com/p/491823
The goal is for the "MAE" to get smaller than the "raw", and hopefully almost as small as the "pred". All these will vary over time. I would be very happy if the "pred" actually shrinks, too, but I'm not sure if it will.
So I am hopeful that you are “very happy” as all your goals seem to have been met…However (don’t you just love that word);
I was wondering if there is any form of correlation between the Low MAE and possibly using the % Influence at that same time as a target, or would it have been purely the lowest based on luck that core inputs (gfs etc) where close at the time.
Reason being that since the low, it has been fluctuating between 1.11c and 1.22c and my thinking is, that by possibly dropping the target to what may be that sweat spot, which was way down at 49.7%
Hope the above makes sense.
date time first day last day #used tpcor intercept rgcor tncor slope dpcor dp bias MAE pred raw %WXSIM-Lite 27/08/2016 3:16:50 AM f16052604.wxf 5991 f16082322.wxf 6080 357 -0.0779 -0.71 C 0.8956 -0.00020 0.9912 0.0083 0.17 C 0.99 C 0.98 C 1.16 C 49.709/11/2016 3:18:27 AM f16080804.wxf 6065 f16110523.wxf 6154 357 -0.0189 -0.17 C 0.9159 0.00090 1.0407 0.0059 0.12 C 1.17 C 1.17 C 1.21 C 61.5
Compare Graphs : https://southfranklinweather.com/weather/wxsimcompare.php
Compare Tables : https://southfranklinweather.com/wxacompareMX-include.php
correc.txt : https://southfranklinweather.com/correc.txt
One last curiosity I have is, (Autolearn/wxsim-lite) Analysis going back by user defined periods in years.
I have a strong reliance/belief in the 10 to 11 year cycle, which has shown over time here in Tassie that we have extreme rain events for example. To my analysis of this I believe we are in the 10/11 year peak for rain (records being created). Admittedly we are in an eve changing Climate which evidence shows we are warming and changing.
Though I would like to understand better the intended logic behind (Autolearn/wxsim-lite) looking back say by a users selected period range of say 1 or 2 or more years, I envisage from information on these, to achieve a seasonal change inclusion, though how can we deal with the previously mentioned events. Sorry Tom it’s an out there one, just had to ask.
Kind Regards,