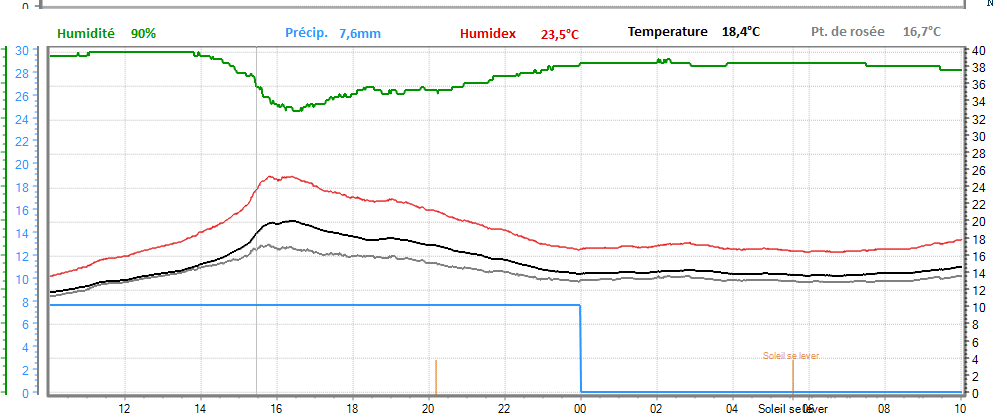
How come my Humidex plot doesn’t appear on my 6/12/24/48/72 hour graphs? It is only visible on my graph window.
Windchill appeared all winter. Heat index won’t appear as well if I plot that instead of Humidex. Is that a bug or something wrong I do? Tx for helping!

I think they only show the standard variables. I plot an extra temp on the main screen and that doesn’t appear on the web graphs either.
Strange because it seems to me it worked last summer. I wonder why it would display windchill plot, but not heat index nor humidex…
I wonder about windchill, too. And as I have set WD not to calculate windchill above 10°C I don’t think it should be shown on the main screen graph, either.
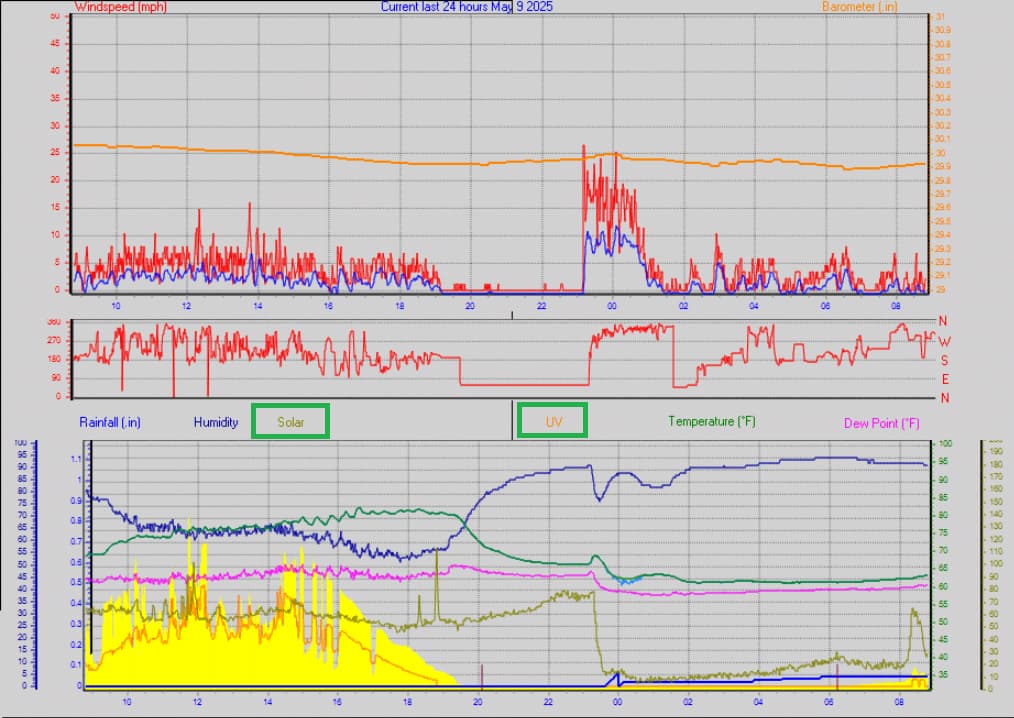
My Solar and UV plots appear on my web graphs for 24, 48, 72 hours, and month-to-date. Here’s the 24 hour graph:
Thanks. I really have no idea why windchill is shown but humidex, heat index and extratemp are not shown, so I was floating an idea about “standard” variables – pressure, wind, temp, rain, solar, UV – which also seem to include the “baked in” windchill and dew point.
It doesn’t worry me in the slightest, but I suppose we could always ask Brian.
Because plotting so many elements on one chart as WD does, I prefer to use and most often view my Highcharts graphs here: Clayton, NC Weather - Realtime Charts
I display wind chill in the cool season and heat index in the warm season.
Im glad that i took all my graphs off of the main WD screen.
Now I just have the info that i need to look at.. ![]()
Well it doesn’t solve the fact that windchill is displayed and not humidex. Is it a malfunction, something I don’t select properly or just a feature that WD doesn’t allow?
I think it’s the latter, but maybe you should ask Brian.