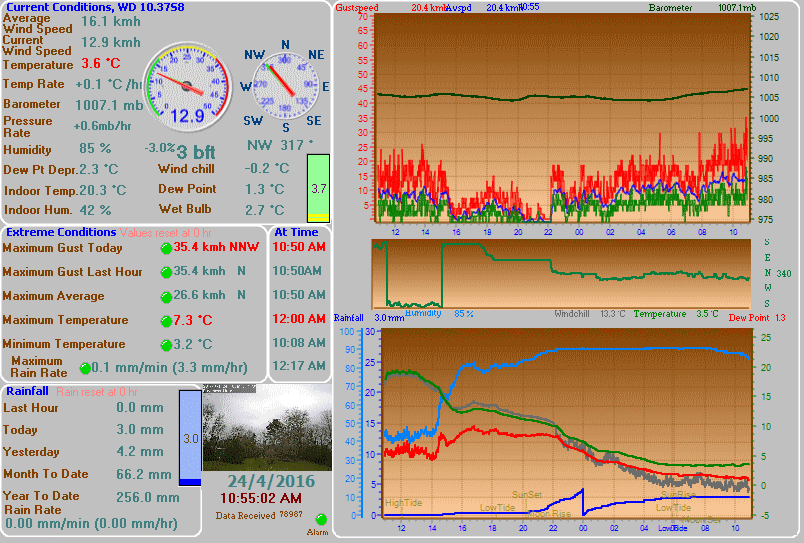
I updated to S08 version and noticed the humidex is not showing anything but 3 dits on the graph area and is showing windchill (not humidex) on the left side. On the Weather Display home page (Weather Display - the Weather Station software) I see the same thing is happening here. Windchill and temperature are the same for the left side and the graph side is showing Humidex …
what likely is happening is that when the temperature is at the level for windchill, that value shows instead of humidex, in the current conditions section
but the graph label has not changed
I will keep on eye on that
there has no been any change to this for a while, so it will not be unique to build 8 I suspect
you do not say which version you were using before
I was using R286 from last summer, my summer time, and it worked great then. I thought that I should update and that is when I noticed that the humidex wasn’t functioning like it used to. Friday (tomorrow) is suppose to get up to 18c and that will tell if it is or isn’t working.
Will let you know what happens.
try the latest .zip update, re the humidex value on the graph side not showing
Thanks Brian, I now have a reading showing up on the graph side after installing the latest zip.
Well another problem developed that is related. Now that the temp went down below 10c (actually 3.6c) the windchill on the graph side is showing 13.3c, which is rather high for windchill and humidex wouldn’t be a factor at this temp. Included a screen shot so you can see what I am talking about.
Actually it seems to have stopped calculating after the peak humidex was reached yesterday. But if I run the mouse cursor over the screen it will start showing the real value again. Seems to get stuck at some point. Shaking the monitor didn’t help, ha ha
I updated again with the latest zip file and the Humidex/Windchill on the graph side is back to 3 dits. I noticed that the check box for “plot humidex instead of heat index” will not stay checked after doing a “save and exit” and restart.
If I hover the mouse over the graph it will show some numbers but won’t update on it’s own.
if you could .zip and email me your wdisplay.ini settings file
and your last31daysdata.inf data file
when the windchill should be showing left hand side
and when the data is warm enough for to plot heat index
sort of thing
I do see there is a bug for that setting not being remembered
the latest .zip update fixes that setting not being remembered in the graph setup (re set that)
I did some process of elimination. The graph setup was first and I unchecked the ones for humidex with no help, still only get 3 dits for windchill on the graph side. Being as the weather turned cold again, I dont have any humidex to plot, only windchill.
Next I set those for the graph back to plot humidex and unchecked the one in Advanced/Misc Settings, Temp/Humidy/Extra Temp/ , unchecked show humidex instead of heat index or windchill.
Did a save and exit, restarted WD. On the graph side it is now showing windchill as it happens. When I put a check back in that box, (Advanced/Misc Settings, Temp/Humidy/Extra Temp/ , show humidex instead of heat index or windchill), the graph side goes back to 3 dits.
So as long as I leave that box unchecked it will let the graph side work and update it self, but will only show windchill on the left side (non graph side)
Hope this helps to locate where the problem might be. If you still need those 2 files you mentioned earlier, let me know and I’ll send them. But with cold temps there hasn’t been any humidex readings since a week ago, hopefully warm temps will be along soon.
