Hello
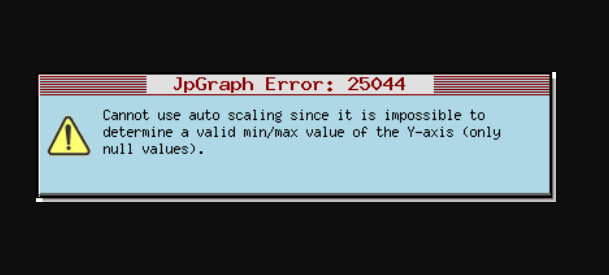
I made this script with JpGraph. Unfortunately I have a mistake and I have been looking for a long time to find the reason.
Can you help me.
Thank you.
Serge
<?php

/**
 * RELEVES DE TEMPERATURE SUR 24H
 * STATION
 */
require_once('jpgraph/jpgraph.php');
require_once('jpgraph/jpgraph_line.php');

$stream = fopen("https://****.net/mor***/customtextout.txt", "r");
$releves = [];

while ($line = fgets($stream)) {
    $decoded_line = explode(" ", $line);
    if (substr($decoded_line[0], 4) == "0") {
        $releves[$decoded_line[0]] = $decoded_line[1];
    }
}

// Création du graphique
$graph = new Graph(1000, 500, 'auto'); // Ici les deux premiers paramètres sont la largeur puis la hauteur de l'image en pixels
$graph->SetScale("textlin");
$graph->SetAxisStyle(AXSTYLE_YBOXIN);
$graph->title->Set("Température sur 24h - Station du Morvan");


$graph->yaxis->HideLine(false);
$graph->yaxis->HideTicks(false, false);
$graph->yaxis->title->Set('°C');
$graph->yaxis->SetColor('blue');
$graph->ygrid->SetFill(false);


$graph->xaxis->HideLine(false);
$graph->xaxis->HideTicks(false, false);
$graph->xaxis->SetTickLabels(array_keys($releves));
$graph->xaxis->SetLabelAngle(90);
$graph->xgrid->SetFill(false);
$graph->xgrid->Show();

// Créer les lignes
$lineplot = new LinePlot(array_values($releves));
$lineplot->SetColor('blue');
$lineplot->SetWeight(2);
$graph->Add($lineplot);
$lineplot->value->SetAngle(45);
$lineplot->value->Show();

// Sortie de l'image
$graph->Stroke();
Are you using the latest version from JpGraph - Most powerful PHP-driven charts ?
07 Aug: JpGraph-4.4.2 (4.4.2)
Support PHP8.2
I copied your script and run it with that version, no errors
Wim
Thank you for this information. It works.
I’m looking for ways to increase the pace of updates. The current step of my readings is 10 minutes and I want a step of 60 minutes as a way to do it.
Thank you.
Serge
I’ve not used JpGraph for many years but I would have thought the way to do that was to average your 10 minute values into 60 minute values in PHP and then plot the 60 minute values.
(Translate)
Hello
Indeed, I followed your instructions and I changed the pitch of the readings in 60 minutes.
Thank you.
Serge
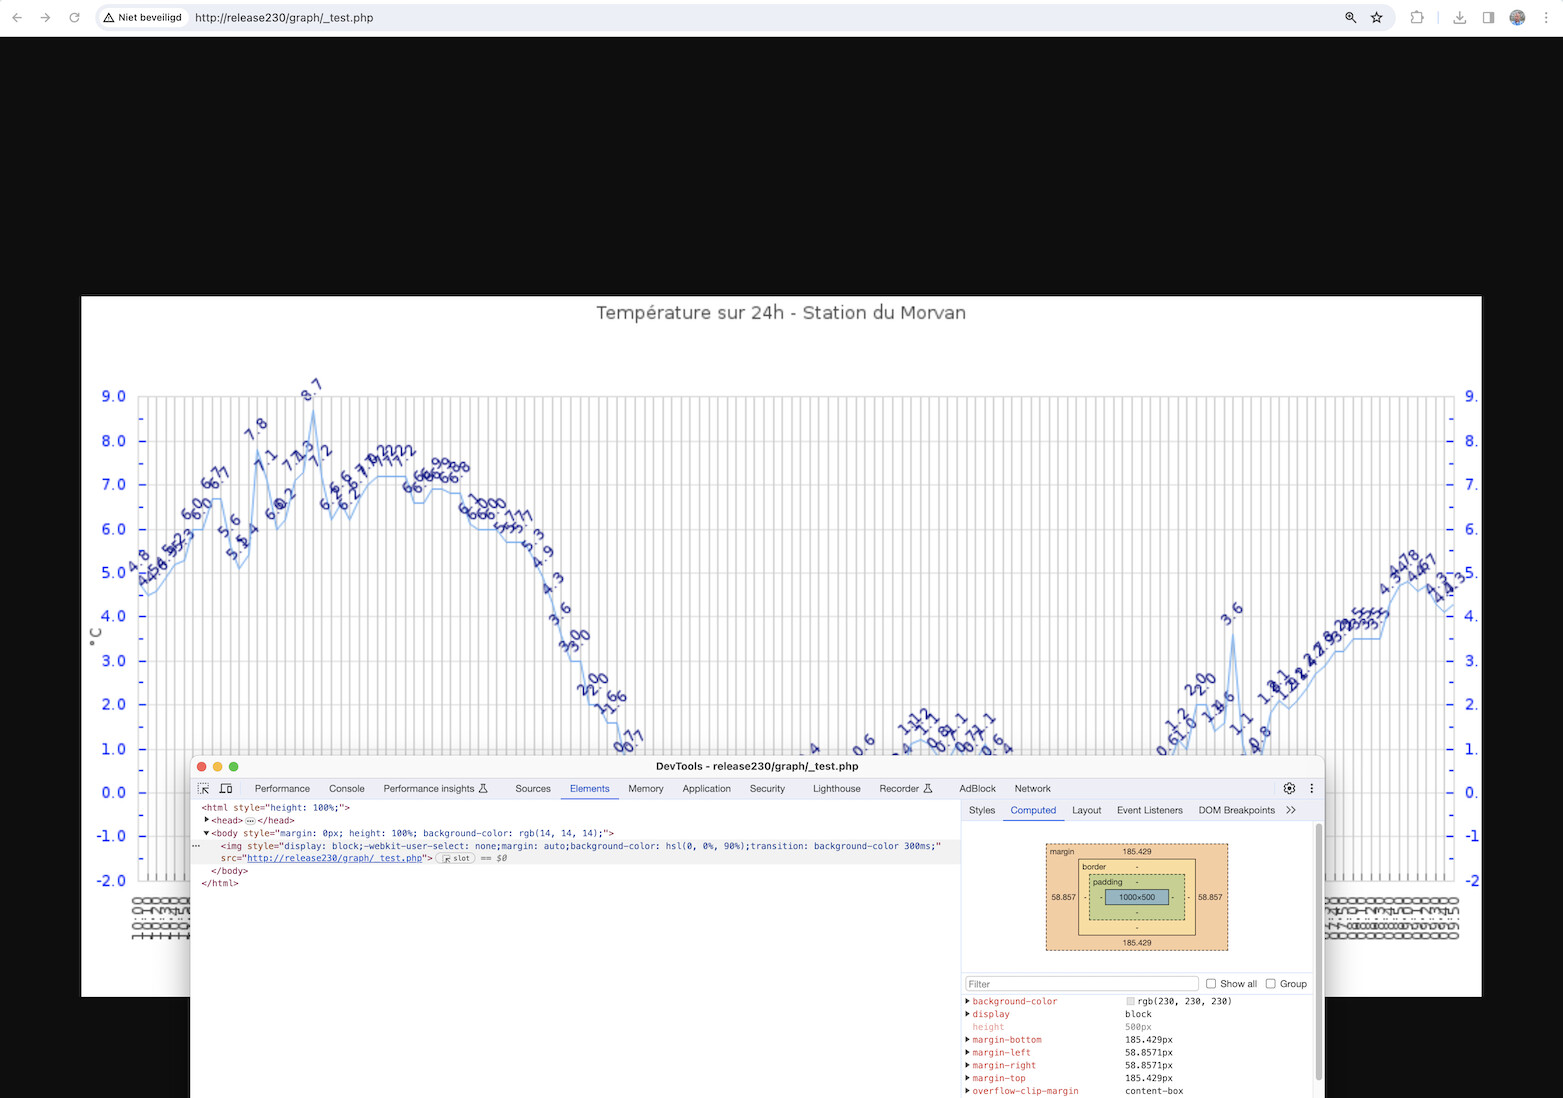
I rewrote the following script with a 30-minute step, it works wonderfully; People are interested.
Serge
<?php

/**
 * RELEVES DE TEMPERATURE SUR 24H
 * STATION DU MORVAN
 * @version 2 - Ajout de null checks, prise en charge du cas où les relevés s'étalent sur plus de 24 heures
 */
require_once('jpgraph/jpgraph.php');
require_once('jpgraph/jpgraph_line.php');

// Ouvrir le fichier
$stream = fopen("https://****.net/mo***/customtextout.txt", "r");
if ($stream === false) throw new RuntimeException("Could not read https://****.net/mor***/customtextout.txt");

// Lire les lignes une par une et répertorier celles qui sont à une dizaine de minutes rondes
$labels = [];
$values = [];
while ($line = fgets($stream)) {
    $decoded_line = explode(" ", $line);
    if ($decoded_line === false) continue;
    if (substr($decoded_line[0], 4) == "0") {
        $labels[] = $decoded_line[0];
        $values[] = $decoded_line[1];
    }
}

// S'il y a plus de 48 valeurs relevées, alors ne prendre en compte que les 48 dernières
// En sachant qu'elles sont listées dans l'ordre chronologique
if(count($values) > 48) {
    $values = array_slice($values, count($values) - 48);
    $labels = array_slice($labels, count($labels) - 48);
}

// Fermer le fichier
fclose($stream);

// Création du graphique
$graph = new Graph(960, 300, 'auto'); // Ici les deux premiers paramètres sont la largeur puis la hauteur de l'image en pixels
$graph->SetScale("textlin");

$graph->title->Set("Températures sur 24h glissantes à la station météorologique du chalet de Préperny (commune de Arleuf)");

$graph->yaxis->HideLine(false);
$graph->yaxis->HideTicks(false, false);
$graph->yaxis->title->Set('°C');
$graph->yaxis->SetColor('blue');

$graph->xaxis->HideLine(false);
$graph->xaxis->HideTicks(false, false);
$graph->xaxis->SetTickLabels($labels);
$graph->xaxis->SetLabelAngle(90);
$graph->xgrid->SetFill(false);
$graph->xgrid->Show();

// Créer les lignes
$lineplot = new LinePlot($values);
$lineplot->SetColor('blue');

$graph->Add($lineplot);
$lineplot->value->SetAngle(45);
$lineplot->value->Show();

// Sortie de l'image
$graph->Stroke();
1 Like