Last night I installed WD 10.37M Build 01 so as to take advantage of the new capability of reading the Wind Chill Sensor inside the Anemometer on my Honeywell TE-923W (aka iROX Pro) weather station.
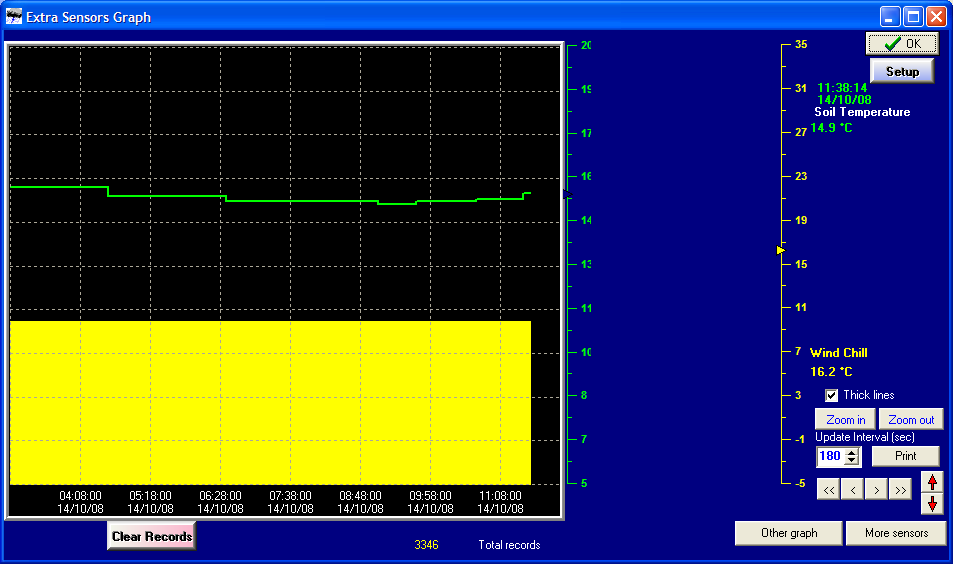
WD is reading that sensor just fine (thanks Brian) but the resulting Extra Sensor Graph is looking a little strange (please refer to attachment).
The temperature as displayed on the Yellow Scale is correct, and updates itself just fine.
But the graph never changes and is “Blocked In” below a line at about 10 degrees on the Yellow Scale.
Does anyone have any idea of how I can fix this?
Thanks for all suggestions ![]()