for some time now I have been seeing rainfall information on Detailed Rain chart “missing” when looked chart is displayed, yet rainfall totals etc, at the bottom are still showing correct rainfall.
I have not been able to resolve this problem.
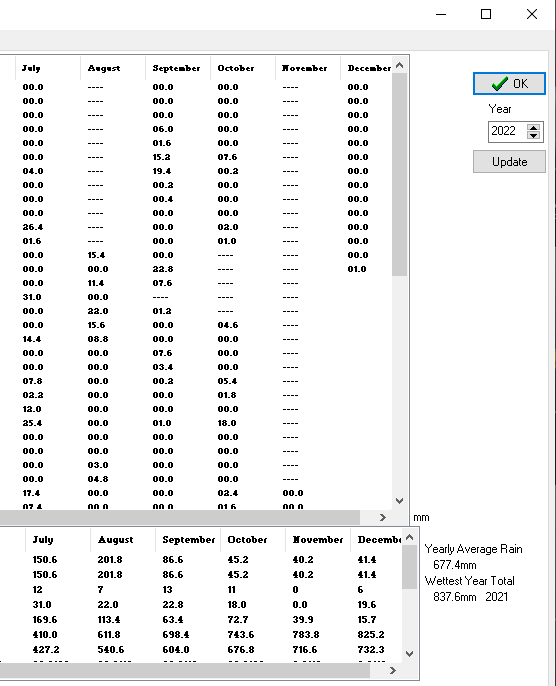
The November data in attached chart is an example. — I have looked at the chart during the month and daily rain has displayed as it should on most occasions. Then it started “missing” readings - both actual data and ‘0.0’ for no rain, to be replaces by ‘…’ fillers
today (13th dec), I looked at rainfall [ as we actually 1.0 mm ] and all but last few days of November have been replaced by ‘…’.
Rainfall data for December is correctly displayed [at the moment]
This has been going on for months to various degrees, and I keep a seperate spreadsheet to record rainfall.
Anybody else have this problem.???
My system is Davis VP2
Total power failure this morning from 06:45 to 08:13
Restarted WD and checked display… Graph shows when power off and data looked ok … Last 7 days rainfall chart shows dates to the 13th then top date was 7th of Dec …???
Downloaded data from Davis console, and all returned to normal, EXCEPT daily rainfall chart.
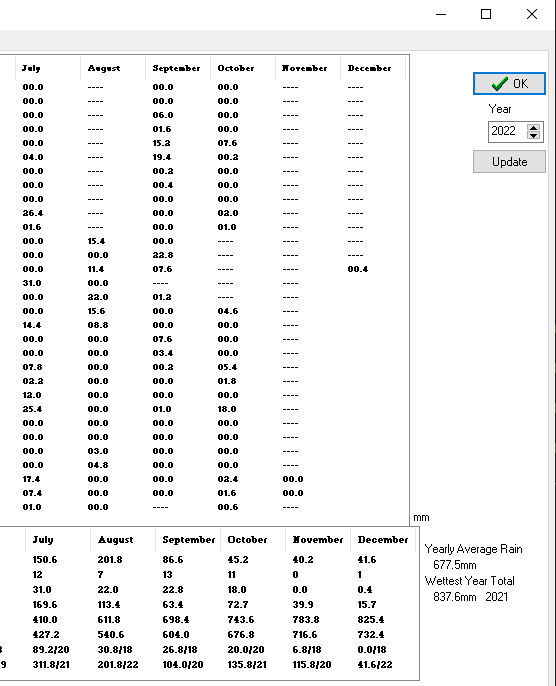
AS can be seen in attached chart, compared with chart I sent in last post, ALL of December data has gone to ‘…’ except todays 0900 reading of 0.4 mm which is correct.
Total for month shows 41.6mm on 1 day [ should be 1.4 on 2 days ] – added Nov and Dec together ??-(rain days in Nov now 0 )
I would like to know: How this occurs, Why This does so and how to fix it, AND When is the problem going to be looked at and resolved…??
I would like to know: How this occurs, Why This does so and how to fix it, AND When is the problem going to be looked at and resolved..??
You’ll need to email Brian directly about this. The users of this forum are just WD users like you and have no input to the problem fixing process or how it’s prioritised.
Unfortunately the power outage probably caused files to be corrupted
The daily values showing as —- are stored in the data files
So check the log files around midnight and in this case also around 9am are ok and then convert log file to graph
I always start with Stuart’s tool at WD Log Checker to look for errors in my log files when I have this type of issue. Inevitably, there is duplicate data in the file. If that’s the case, I remove the bad data with a text editor, save the file, and then go back to WD to convert the log file(s). I have instructions on my website here: https://novawx.dscloud.me/wd-software/How-to-correct-bad-data-in-WD.pdf. Hope this helps.