WD 10.37S126 Registered Davis Vantage Pro running on a laptop, W7Pro SP1. No other software running.
Davis console connected with Weather Link Data to the serial port, COM1
Has been running for over 12 months with no problems.
No hardware changes, no (as far as I know) software changes.
For the past few days I’m getting Data Received stopping, and if it’s relevant, the Temperature (3rd down, top left) becomes blank.
Croncloud continues to upload, but only with the last known data.
I searched the forum and found (in an archived thread) reference to -
setting “Restart WD instead of reboot”. Should the line above (Reboot computer…) also be ticked? I’ll try that.
I’ve also ticked Log raw data… latest(?) file created lists final_data[0] to final_data[99] - but I think I need to save that after WD stops receiving data
But it doesn’t answer the question of why it has started (and continues) to misbehave.
Is it worth powering down / resetting the Davis console?
Hope there’s a solution. Thanks
Still having random stoppage of data from my Davis VP2.
I’ve emailed Brian a couple of times. On the latest email I included rawultimeterdata files but have yet to receive analysis of those.
When it stops the temperature reading on the main WD screen goes blank, so I’m wondering if that is a sign that the temperture (and humidity) module is at fault. At 51 gbp I’m reluctant to buy a replacement on the off-chance.
I’ll post another message in the Weather Station Equipment section of the forum.
Are you using a Davis console and if so what is that showing when WD is showing a blank temperature?
Yes. Davis console connected with serial data logger. Console displays correctly.
I’m hoping Brian can shed some light on it from the files I’ve sent him.
Richonite - Yes I have been having the same problem.
started several weeks ago and when data is “recovered” via “Extract data from Davis…” Option, and having WD re do graphing display, the problem gets worse.
Graphs now DO NOT update to show correct time/ data and the “Yesterday’s” data I have displayed in the middle of screen is totally wrong…
The next time this error occurs, the “Yesterday’s” data will some times be incorrect OR be OK…
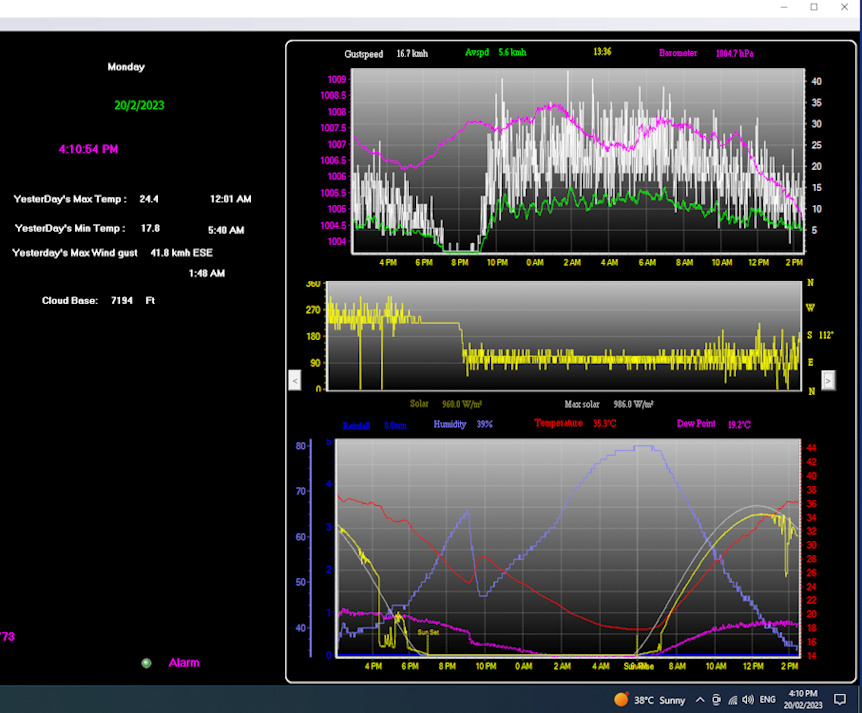
Today I had this problem and "updated "data and got the display as seen in screen shot (image 1) – NOTE the temp display graph and times …??
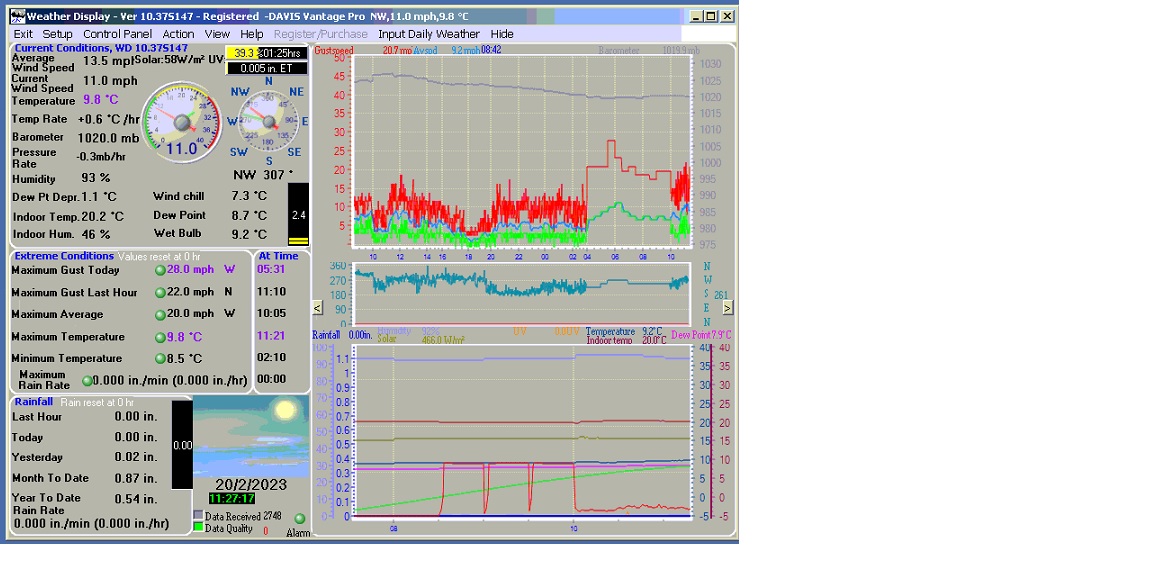
I checked the WD computer 2 hrs later and the Temp graph is as in screen shot image 2.
After closing program and rebooting computer, WD auto starts, and screen shot shows Shows “Yesterdays” data to be totally different and Temp window has NOT updated - still shows last time just after 2 pm local…
Any one else with this problem …
Richonite - Yes I have been having the same problem.
started several weeks ago and when data is “recovered” via “Extract data from Davis…” Option, and having WD re do graphing display, the problem gets worse.
Graphs now DO NOT update to show correct time/ data and the “Yesterday’s” data I have displayed in the middle of screen is totally wrong…
The next time this error occurs, the “Yesterday’s” data will some times be incorrect OR be OK…
Today I had this problem and "updated "data and got the display as seen in screen shot (image 1) – NOTE the temp display graph and times …??
I checked the WD computer 2 hrs later and the Temp graph is as in screen shot image 2.
After closing program and rebooting computer, WD auto starts, and screen shot shows Shows “Yesterdays” data to be totally different and Temp window has NOT updated - still shows last time just after 2 pm local…
I am also sending this problem to Davis Inst. to see if it may be a problem with VP2
any one else with this problem …??
Cheers
John Y

I think you need to try a power off reboot of the console
Set to setup mode and remove power lead and batteries and some say remove the logger for a few minutes then put back in check it’s firmly seated then power back up
Has windows updated the drivers for the serial /serial usb recently
If a serial usb adapter it may failing try a replacement
apologies for the duplicate post … missed the attachments and sent by mistake
I’ve already tried a reboot of the Davis console and also my laptop.
But this morning other things have happened. See my reply to Ex-Whr.
I had something similar happen…in my case it turned out to the datalogger hardware. I had physically moved the Davis console and the datalogger became semi-loose in the socket giving me strange readings or partial no readings.
I’m having trouble interpreting your graphs :?
This morning I’ve noticed something different.
About 4am WD stopped. When I restarted it I noticed the “pop-up” of Davis VP History Data Extraction.
That’s never happened before and I’m not aware of any changes I’ve made to the WD setup.
It “filled in” the gaps in my graphs. Never seen that happen before.
Secondly I’ve noticed odd solar readings. Bottom graph expanded (time wise) and I’ve changed to colour of the solar plot to make it more obvious.
First I’ll check the solar sensor and its lead where it is plugged into the ISS.
That’s something I already tried. In fact I powered down the console - carefully following Davis instructions - and unplugged and replugged every connector (while WD wasn’t running). It didn’t make any difference ![]()
At least this morning I have noticed something (solar readings) that might be the root cause of WD stopping because Brian suggested that “out of range” value(s) might be the problem
May worth trying a new battery in the ISS
Your screen grab…odd…the wind graph appears to show a section where it appears the data import was done and the time period was longer…perhaps 1 minute interval or longer, whereas live data is 2.5 seconds. I’m guessing you log your data at the "slower’ rate to allow storing longer periods in the datalogger. I don’t think it’s a problem for WD but it does affect the appearance of the graph data being displayed and you may miss some hi/low readings.
The other thing I noticed is the time line on the graphs…when I see the time not spaced evenly it usually means the log file is skewed. I suggest running your log file through the log checker. Stopping/starting WD can cause time periods to be duplicated and skew the time line. The log checker is a great tool to find these type of discrepancies, There should be 1 entry in the log file every minute for 1440 entries in each day. What can happen is if the import of missed data duplicates a time period then the graphs get goofy. It’s something fairly easy to check and correct.
When WD starts “acting” weird the first thing to check is the log file.
Log checker: http://www.stella-maris.org.uk/checklogs.php
Thanks for the suggestion, but it’s a cabled VP2, not wireless :lol:
I’ve now spotted 100% solar - but it’s an overcast day.
I’ve unplugged the (only 18 month old) solar sensor inside the ISS.
If WD runs ok maybe that sensor has developed a fault.
I’ll email Brian and let him know what happens and also contact the weathershop and Davis for suggestions on how to check that sensor.
In Setup/log files logging rate is set to every minute.
But in Control Panel/Data Logger it is set to 30minutes. I see that 1 minute is recommended. I don’t remember changing that. Now back at 1 minute.
The other thing I noticed is the time line on the graphs...when I see the time not spaced evenly it usually means the log file is skewed. I suggest running your log file through the log checker. Stopping/starting WD can cause time periods to be duplicated and skew the time line. The log checker is a great tool to find these type of discrepancies, There should be 1 entry in the log file every minute for 1440 entries in each day. What can happen is if the import of missed data duplicates a time period then the graphs get goofy. It's something fairly easy to check and correct.When WD starts “acting” weird the first thing to check is the log file.
Log checker: http://www.stella-maris.org.uk/checklogs.php
The uneven time line is due to WD stopping receiving data, then restarting some time later.
Until this morning I never saw the data extraction.
With the solar sensor now unplugged inside the ISS I’ll see if WD behaves. May take 24 hours for me to see.
I didn’t know about that log checker. Thanks for that link.


In theory that should not happen. If WD is not receiving real-time data, and continues to log the last data received (flatlines), then you would need to edit the logfile to remove the bogus data before starting WD. That way, when WD imports the missed data (assuming the datalogger contains good data) it will append to the logfile and then carry on with real-time data entries in the logfile.
With the solar sensor now unplugged inside the ISS I'll see if WD behaves. May take 24 hours for me to see.
:scratch: Never heard of that before. Must be something Brian wrote in the code to verify solar readings were probable???
I didn't know about that log checker. Thanks for that link.
Please let us know how you make out with the checker and how you’re getting on with the issues you have with WD.
Dan
Been using WD for many years, initially with a 1-wire system. That started to get unreliable (humidity spikes in particular) so 18 months ago I bought a Davis VP2+.
That’s been working fine until approx 1 week ago when this “received data” stopping made an appearance.
I just scratched my head and did a save/exit then restarted WD.
It was only in the last couple of days that the data extraction pop-up appeared, so previous to that the timeline had gaps.
I’m not going to go back now and edit older logfiles.
With the solar sensor unplugged WD still stopped receiving data - at about 3am today.
I’ve now been looking at logfiles, in particular 22023lg, 22023vantagelog and 22023extralog.
I’ve haven’t used the checker yet, just visual inspection of the files (a copy, not the live log)
Can’t see anything suspicious in 22023lg. In 22023vantagelog I can see the solar data. That showed 100% at 09:39.
The extralog is interesting. I entered the CSV into a spreadsheet.
I have no additional sensors.
Yesterday temp2 changes from -100 to 255 about the time WD stopped and continues at that value.
hum4 also changes. At the start of the month it shows 0. 5th Feb started getting low readings (max 11, 10am to 3pm)
Similar the next day. I wonder if that is UV? Yesterday 15:29 to 15:47 it showed -100. Today 03:58 to 09:25, during which time WD was not receiving data, it shows -100.
I’ll unplug the UV sensor and see if that eliminates the problem. I can’t find uv or hum4 in any of the setup screens.
I can’t find your website to look at what your graphs are displaying after WD stops receiving data.
I seriously doubt the solar or uv sensor are the cause of this. Without more data it’s hard to discern what is happening. I suspect that the battery in the ISS is bad or the supercap is bad. Basing that on the fact that readings stop overnight and on cloudy days with little sunshine. When my battery goes bad I see flatlines on most of the sensors except the indoor temp and barometer sensors since they are in the (hopefully) mains powered console.
My comments about the logfile were to simply educate you on why the displayed timeline on the graphs was not showing correctly. However, there is a chance that some historical readings could be wrong. If having historical data is important to you then you definitely want to correct the logfiles and do the re-creates so WD can re-read the logfiles and get accurate data in the historical sections. Everybody is different, some don’t care and others complain if the temperature or rainfall is off by 0.001.
If it were me, I would hook up the solar and uv sensors, replace the battery in the ISS, and see what happens.
As its cabled i would try a different power supply on the console i have seen power packs fail in the past so worth a try