I am trying to locate a nice graphic for displaying my Davis AirLink AQI readings. There are plenty out there that use AirNow gov data but I want to use my own data. Has anybody modified or authored a nice AQI display? Something similar as the wxsticker that shows pm2.5 and temp/humid/wind would be nice. I find the current offerings remind me of the DOS under Windows 3.1 ![]()
what about this one?


do you mean like this as I have changed the aq picture
see website?
Hythe - Kent Home Weather Station (ecoLcl version) (hytheweather.co.uk)
Just got to make it transparent
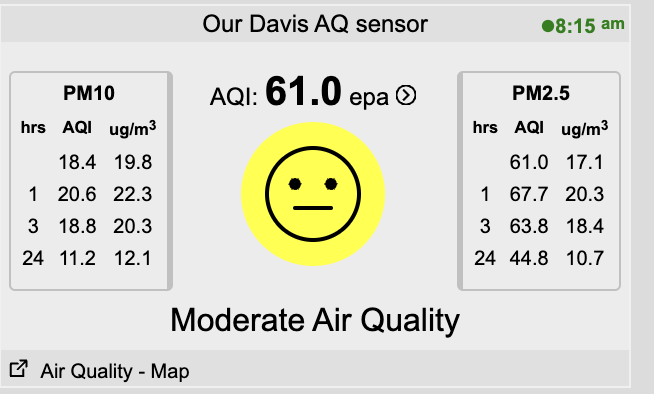
I have not found a graphic I like yet, but this one isn’t bad. Not sure why I own a sensor that measures PM1, PM2.5 and PM10 but all the graphics only show PM2.5. Perhaps that data would be of interest to people.
The Davis AirLink also provides temperature, humidity, dew point, heat index, and wet bulb data. So ideally the widget would be able to display all the parameters. I’m not interested in any forecast, just the facts.
Here’s an image that if it had all those would be a great:
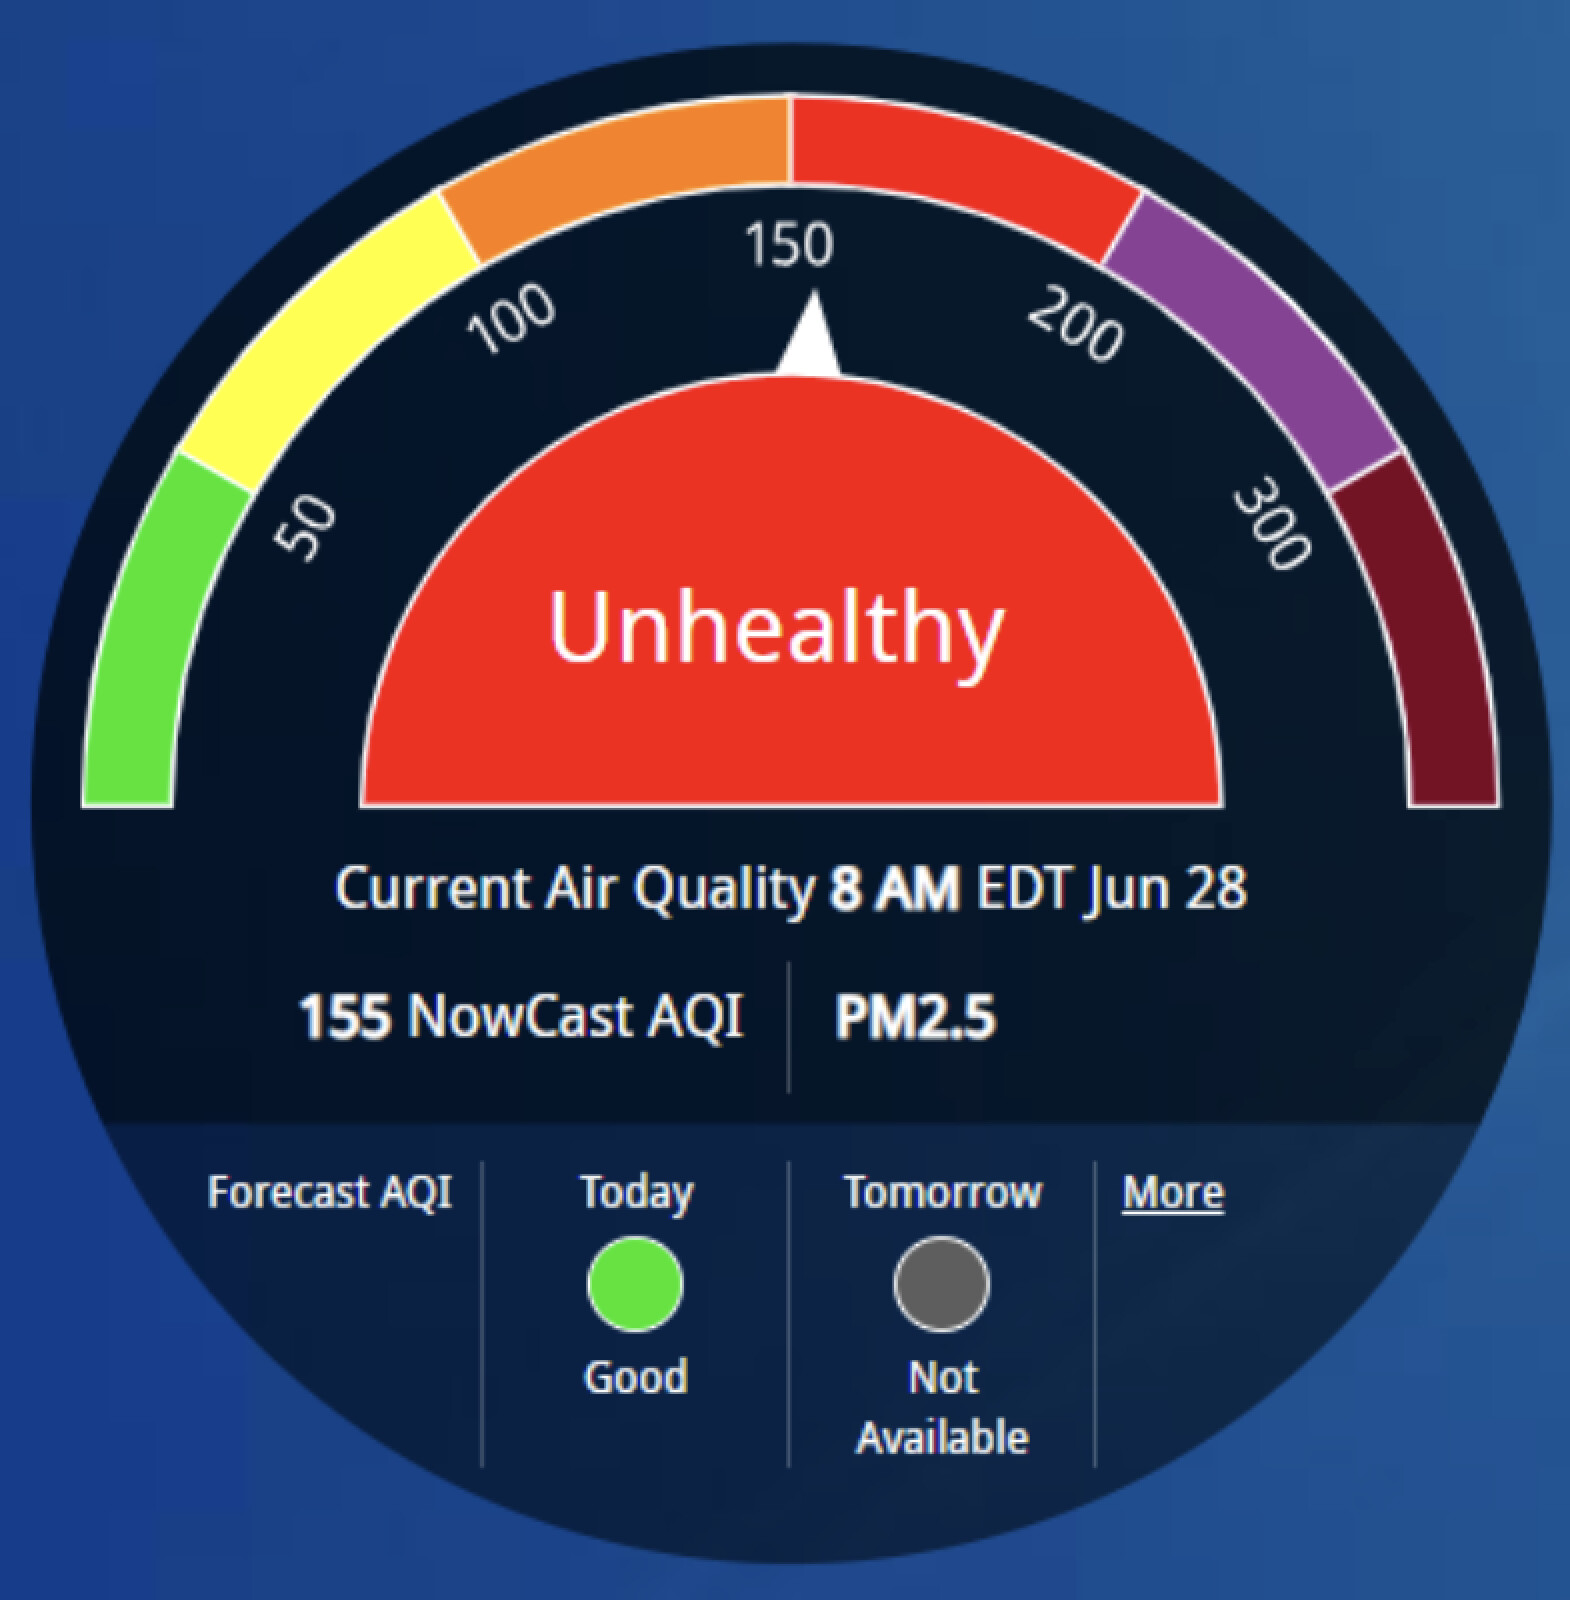
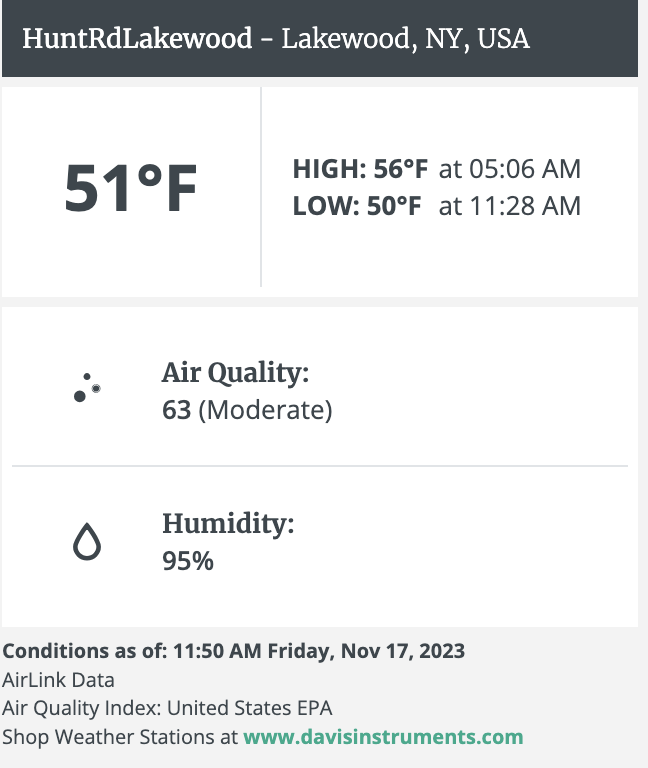
And here’s what Davis supplies:
I don’t know the AirLink but if it’s anything like the PurpleAir these parameters are only to check the sensor environment: see PurpleAir Sensors Functional Overview - Sensors - PurpleAir Community
Your pws_dashboard shows pm2.5 and pm10, in main block and popup ![]()

Sorry I wasn’t referring to my graphics but rather the graphics I can find online. Thanks for everyone s comments. I was just hoping to find something more interesting.

It’s unfortunate that almost all of the widgets found online are linked to a specific brand of sensor, and, only display the “Official” AQI numbers. I’m not sure why they do that as I think my data from my Davis Airlink is more useful. Same as air temperature, why would I care what the OAT is 50 miles away when I know what the AOT is in my own backyard. I’ve never been a fan of extrapolated numbers based on some algorithm.