Hi (repost as it didn’t like the attachments size first time around - apologies if this is a duplicate!)
I’ve recently purchased the Advanced Graphs module in order to generate some useful graph history for my website. All appears to be working well except for the “Temperature Chart” graph. No matter what I do, it always seems to display the same yearly data.
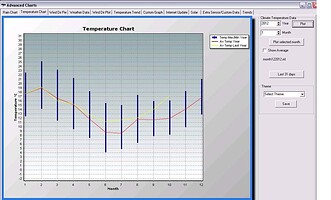
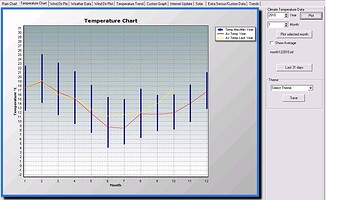
I want to generate yearly temperature graphs based on my data for 2009, 2010 and now 2011. However, the graphs always seems to show the same data, no matter what year I change to. In fact if I tell it to plot 2012, it says it’s reading “month122012.inf” (which doesn’t exist by the way!) and produces the same graph. If I look at the data under the customization, it’s the same data each time I change the year.
Has anyone else struck this issue with the Temperature Chart? Is it something I am doing wrong? I have confirmed the temperature data is OK as I can generate a correct graph for temperature using the “Temp/Wind/Rain Chart”. I have also checked my original data and in fact removed all *.inf files and recreated them just in case there was something wrong.
Attached are the two graphs for 2009 and 2012(!).
Appreciate any feedback on this.
Cheers
Maree

