Is there a way to adjust the (Energy: 343 W/m2 (82%) ) The solar is setup up correctly but never goes over 85% Even in the winter when there is no humidity?
Mark
Is there a way to adjust the (Energy: 343 W/m2 (82%) ) The solar is setup up correctly but never goes over 85% Even in the winter when there is no humidity?
Mark
use the VP solar offset
in the solar setup
Interesting. I assume you are using a Vantage Pro sensor?
I’m in contact with Davis on this same subject. My e-mail to them read:
[quote]Hi!
I’ve recently added a solar sensor to my Vantage Pro 2, with 12 m of your connection cable (the ISS is in a partially shaded position).
Today, as I’ve observed many times, we have wall-to-wall sunshine with a fairly low 30% relative humidity and visibility of >10 km. According to my calculations, the max. irradiance is 1289 W/m
Do a search and you will find several people with the same question. I have not seen a post where it says the solar matches what it should.
Mark
And I agree that it is most likely a Davis problem.
When I changed my signature I forgot to put the station info back ![]()
Mark
watch for any fading of the solar sensor cover cap (and UV sensor)
also any pollution in the atmosphere will reduce the readings from expected
I bumped mine up 123% It seems to be working correctly now.
Mark
I’ve run a Davis solar sensor with WD for more than 8 years, and have participated in this same discussion a number of times.
It is true as Mark states that the issue of the Davis sensor output being lower than the predicted value has been raised before, however, as I recall it has never been an NZ or southern hemisphere user who has raised it. Brian can confirm that there is no comparison between clear skies in NZ and those in California, but the latitudes are similar and the (wd) calculator will predict similar solar radiation values for the two locations (for the same sun elevation).
The California Dept. of Water Resources (DWR) has a network of weather stations, and some have solar. The stations I have seen use professional grade sensors, often Vaisala.
It has been clear and sunny here for the last few days. This solar calculator (comparable to the wd one) shows max solar for California currently between 1,250 and 1,300 watts/m2 depending on latitude. Looking at the DWR solar data I see that only the mountain stations at higher altitudes are close to 1,200, the lower elevation stations are maxing out around 1,000 - which matches what I see being reported by the Davis stations with solar that I found through wunderground.
After playing with this for 8 years I’m convinced that the Davis is reporting correctly, that the calculators are reporting values that are too high for lower elevations in the northern hemisphere, and that sadly we have really dirty air ![]()
I picked a day when the sun was out with low humidity. And then I ended up putting the value at 123% to get 100% solar reading.
Mark
Niko
Thanks for your input. I still find it hard to believe that, taking the figures in my Reply #2 above, I would need to add 45% to bring the measured up to the theoretical, this ratio being fairly consistent. Let me describe my location. Cyprus is a small Mediterranean island with virtually no industry. The weather patterns come in generally from the West, perhaps WSW. There is almost no land in that general direction for about 1,000 km (Crete), which is similar in nature and an even smaller island. Beyond that, over 2500 km away, is Tunisia. The total population of the Republic is a tad under 800,000. There are two “large” conglomerations - you would call them townships. Nicosia (~150,000) is ~30 km north of here, plonk in the centre of the island, and ~100 m altitude and Limassol (~120,000) is 50 km SW, on the S coast. Both are “clean” cities, except that Nicosia is prone to high ozone levels due to the photochemical reaction between VOCs and NO2, on the rare calm day, as it lies in a bit of a hollow in the Mesaoria, a W-E coast-to-coast plain, which tends to channel the wind between the two mountain ranges.
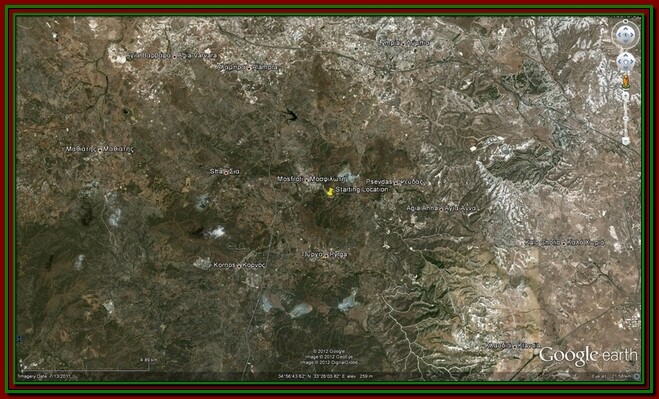
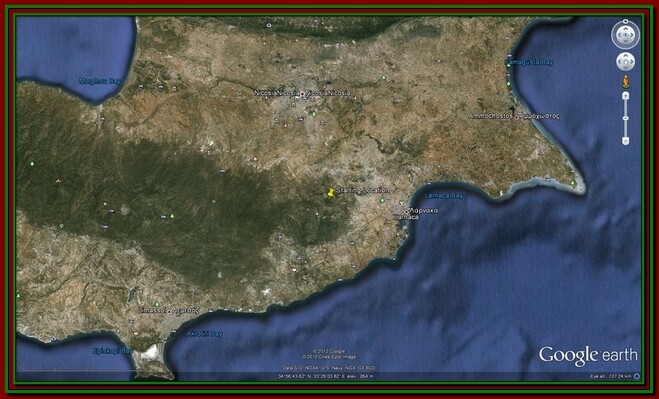
As you can see from the Google Earth views, my location is very rural. I’m surrounded by hills and to the West we have the mountainous Troodos Massif, little inhabited, rising to a tad short of 2000 m. There are isolated forest stands of pine trees, but the main forests are towards the W. Coast on the other side of the mountains: it is therefore not probable we would have undue natural pollution of terpene emanations from the trees. In hot weather, as now, we often have sea breezes coming from the S coast (sparse population), starting about midday. We also tend to have a SW katabatic wind in the late afternoon. When there is a W prevailing wind, we tend to have foehn weather, warm and dry with excellent visibility but this is not as pronounced as the Alpine foehn or the US Chinook.
There is one weather condition that obscures the sun: from February to late April, we occasionally get a Khamseen dust storm blowing from N.Africa, notably Libya/Egypt but this is not relevant in this thread.
I’ve gone to lengths to explain why I find it unlikely that atmospheric conditions would explain why I would have to boost the VP2 solar readings by as much as ~45% to reach the theoretical values. As I mentioned earlier, UV values do not seem to be attenuated, as far as I can anecdotally judge, and I would have thought that pollution would attenuate short wavelengths more than the visible/near IR.
I’ve had word that Davis are examining the problem and will let me know.
Humm I just might visit the Devil this winter ![]()
Mark
I am familiar with Cyprus and that general area, and yes, I am somewhat surprised by your results. I did note that the non-expat Brits were posting about saharan dust in the UK, and if your graph is not a completely smooth curve

then you don’t have as clean a sky as you think. I also see that your humidity is high. Looking at the DWR network and my own data I don’t recall seeing high (i.e significantly > 1,000) numbers unless the humidity is very low, although I haven’t found a good reference for the impact of humidity.
It’s entirely possible that your particular solar sensor is reading low, my remarks were aimed at the general perception of the Davis sensor as underreading, not your particular case.
Are there any official/professional stations on the island that could be used a reference?
Yes, that particular day had a higher-than-usual RH, ~50%, more usually ~30 %. Below is today’s readings. As you can see, the theoretical max was 1316 W/m
I have struggled with this same topic and even had my sensor replaced by Davis. The result was the new sensor produced values just slightly higher than the old one. I have concluded from review of data and other sensors the same thing Niko did. The sensor values are what they are and basically correct for our locations.
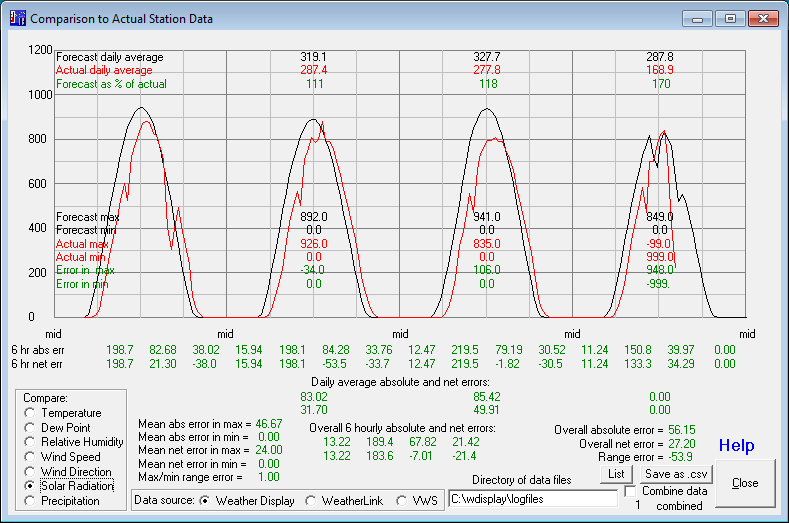
I can offer that WxSim appears to attenuate and correct more realistically for our atmosphere in the WRET utility. I don’t know how Tom is calculating the curves but it shows at 40.3N I should expect 1000 w/m2 on a clear day with low humidity. WRET drastically lowers expected values for the hot and hazy weather we’ve been having lately. I have attached a screenshot showing that the sensor is producing results much closer to Tom’s calculations than what WD uses.
Chipperdog, I agree with you. When I adjust WD for the expected solar radiation it throws WxSim’s expected solar radiation completely out of wack. Tom and I went through this when he was doing my customization and my reading in WxSim were way to high after I adjusted the readings in WD up by +20 - 30 %. I think the expected readings from WD are in completely clear free space. Just my 2 cents.
Cheers
![]()
MikeyM
A few quick comments…
I found this Cyprus University of Technology paper. It’s not very detailed but it does have a chart comparing the results of a new prediction model, with actual values for Nicosia:

Not sure why you would have a noisy peak, except that I guess if there is noise it would be more apparent on the most horizontal section of the curve :?
By low humidity I’m thinking of < 20 %
1316 W/m
when you come to the southern hemisphere, you will realise what clear atmosphere is like
bright colours, real bright sunlight
and crisp and clear visibility all they way to the horizon
on good days (i.e with no maritime salt spray and low humidity, we can see colour diffrences of vegetation on mountrain ranges 100 miles away ![]()
Unfortunately my solar log is missing for most of the month (my fault I think :oops: ) but a local Davis VP+ station has kindly sent me their log. Here are three charts for June 10th thru 28th comparing solar radiation measured by a Davis solar sensor with two nearby Department of Water Resources stations. First chart is a simple plot of the Davis/WD station’s solar, the station is at 1,800 ft ASL, second a DWR station at 800’ ASL about 30 miles south, and third another DWR station at 1,600’ ASL about 30 miles to the north.


Thanks, all. for your interesting inputs.
I’ve sent the following message to the official Met Service to see whether my readings are realistic, with regard to their own instruments.
[quote]I’ve recently upgraded and recalibrated my weather station in Mosfiloti - http://weather.cypenv.eu/ - at 34
thats the other way of doing it, lowering the threshold