Raspberry Pi Lightning Detector - Version 3.2

If i turn off auto calibrate and run the manual calibration it comes with a value of:

Starting calibration run - Please wait approximately 16 seconds
Success!
Tuning Capacitor setting - 0x02 - 16 pF
Percent variance = 0.13 %

The same as auto calibrate.

If i want to change to a higher value what should i fill in in the config file?
tuning_cap = auto to
tuning_cap = 5 or the hex value?

Never mind. Filled in 5 and the website showed that at update.

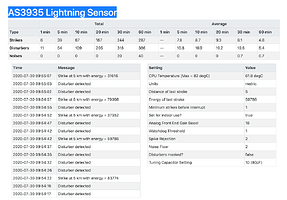
But even at 5 a lot of strikes (see attachement)

What to do, even higher value?


try sudo nano /boot/config.txt look for #hdmi_force_hotplug=1 and uncomment it hdmi_force_hotplug=1 also the 2 hdmi lines under it if not already uncommented
you may also need to check sudo raspi-config go to advanced then A5 and set a DMT number

That’s interesting. I guess there must be some antenna/sensor combinations with low values otherwise they wouldn’t give a 0-15 range for the setting. I’ve only ever seen values from 5 to 11, but I admit that is from a very small sample size!

As for setting the value, either hex (0x02) or decimal format is fine. I’ve used hex because at the sensor register level I’m often working at bit level and using hex just avoids a bit of mental arithmetic to convert from decimal to hex/binary.

Result with a value of 10:


Going to a higher value probably won’t help. It will just detune the antenna which will probably have the effect of missing more distant strokes. As you get ‘2’ with both auto and manual tune then I’d stick with that rather than 5 unless I can find a fault in the calibrator (I’m starting to look this morning). If you want to see how ‘good’ each tuning value is, edit the calibrate_pig.py program and find the line:

(lco_index, lco_variance) = as3935.calibration_run(run_period=increment_time, lco_divider=128, debug=False)

Change ‘debug=False’ to ‘debug=True’. Then re-run the calibration (sudo calibrate_pig.py X). You’ll get results for each tuning value from 0-15 and how close in percentage terms to the ideal value. I’d be interested in seeing the results from this kind of run.

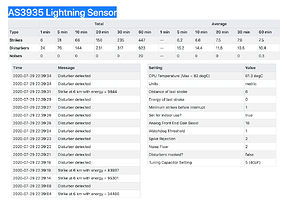
One thing I’ve noted from your two posts with the strikes showing is that they’re all fairly local and with fairly low energy, e.g. in a previous post they were all 1km away and in the latest post they’re all 6km away. The energy value is something invented by AMS for the sensor…it doesn’t have units but its maximum value is 2,000,000. I’d expect real local strokes (I know you’re not really seeing any!) to be higher energy, but yours are relatively low on the energy range for such local (alleged!) strokes.

I think you’re seeing something that’s sparking locally and the sensor is interpreting it as lightning. It could be something like an old electric motor where the commutator is worn and sparking, and I’ve heard of electric fences in farms causing problems for other lightning detectors in the past. TAG welding would cause problems, but I doubt if there’s anyone welding 24*7…unless there’s a nearby factory with an automated welding line somewhere close by?

I’d suggest that you investigate with increasing the values of ‘watchdog_threshold’ and ‘spike_rej’ in the config file to see if you can use those to reduce the spurious strikes you’re seeing. You’ll need to restart the monitor process each time you change one of those values (sudo systemctl restart as3935_monitor.service). I don’t know in your case which value or what combination of values might help, but try increasing the watchdog_threshold initially to see what that does to the output, then try putting watchdog_threshold lower (but probably higher than 1) and then increase spike_rej to see what effect that has. You’ll probably need a combination of both being higher though.

Finally, it’s possible that if there is a local source of sparks, and it’s generating a lot of them then it might just be overloading the ability of the software to keep track of all of the false positives. I don’t know how many strokes the software is capable of handling, but if the brushes in an electric motor are very work then the motor could be generating many tens of sparks per second and the software may not handle that many. Just thinking about this, if you have a medium wave AM radio handy you could possibly use that to track down local electrical noise. Tune to where there’s no station and as you get closer to noisy sources the level of ‘static noise’ will go up. With something generating regular sparks you’ll even hear the tone of the static noise change to reflect the spark frequency. The earliest radio transmitters used modulated sparks to generate the radio signal…which brings us right back to how the AS3935 works in the modern day!

Still showing the 1-6km strokes with relatively low energy so antenna tuning doesn’t appear to be affecting things too much…although it would be affecting the ability to hear more distant strokes if there were any.

Setting back to 2.

the results of the calibration run wtth debug:

Starting calibration run - Please wait approximately 16 seconds
calibration_run - At 0 pF 3931.0 IRQs/sec with variance from ideal of 24.8 ( 0.63 %)
calibration_run - At 8 pF 3918.0 IRQs/sec with variance from ideal of 11.8 ( 0.30 %)
calibration_run - At 16 pF 3905.0 IRQs/sec with variance from ideal of -1.2 ( -0.03 %)
calibration_run - At 24 pF 3894.0 IRQs/sec with variance from ideal of -12.2 ( -0.31 %)
calibration_run - At 32 pF 3880.0 IRQs/sec with variance from ideal of -26.2 ( -0.67 %)
calibration_run - At 40 pF 3872.0 IRQs/sec with variance from ideal of -34.2 ( -0.88 %)
calibration_run - At 48 pF 3856.0 IRQs/sec with variance from ideal of -50.2 ( -1.29 %)
calibration_run - At 56 pF 3844.0 IRQs/sec with variance from ideal of -62.2 ( -1.59 %)
calibration_run - At 64 pF 3832.0 IRQs/sec with variance from ideal of -74.2 ( -1.90 %)
calibration_run - At 72 pF 3820.0 IRQs/sec with variance from ideal of -86.2 ( -2.21 %)
calibration_run - At 80 pF 3810.0 IRQs/sec with variance from ideal of -96.2 ( -2.46 %)
calibration_run - At 88 pF 3798.0 IRQs/sec with variance from ideal of -108.2 ( -2.77 %)
calibration_run - At 96 pF 3786.0 IRQs/sec with variance from ideal of -120.2 ( -3.08 %)
calibration_run - At 104 pF 3776.0 IRQs/sec with variance from ideal of -130.2 ( -3.33 %)
calibration_run - At 112 pF 3759.0 IRQs/sec with variance from ideal of -147.2 ( -3.77 %)
calibration_run - At 120 pF 3748.0 IRQs/sec with variance from ideal of -158.2 ( -4.05 %)
Success!
Tuning Capacitor setting - 0x02 - 16 pF
Percent variance = 0.03 %

Hi Harold

It’s good to know you got it running on the latest Pi ‘beast’. I don’t have an 8GB model (yet!) That’s reminded me that I must try it the software the beta 64-bit OS at some point to try to keep up with all the latest technology.

The Python eventlet module requires dnspython although I don’t think I use any features from it. It’s not clear from the log whether it didn’t install dnspython or whether it did and just complained about the version mismatch. If you do ‘sudo pip3 freeze’ look in the list of installed modules to see if you can see dnspython. On my Pi it’s showing v2.0 is installed. eventlet is a nice to have…the ‘monkey_patch’ option just makes a number of standard routines ‘greener’, i.e. use less energy for the same power/performance. You can easily remove the reliance on eventlet by editing as3935_web.py and commenting out the following lines by adding a ‘#’ at the start of each one. The lines are at the top of the program so easy to find.

import eventlet
eventlet.monkey_patch()

Alternatively you could try upgrading the Python3 version, but I’ve never done that and I don’t know if it’s possible or how easy it is to do.

That doesn’t explain why the monitor service failed though. I can suggest a couple of things to try…

  1. Look in /var/log/as3935_monitor.log to see if there are any errors or warnings being reported.
  2. Try running the monitor process manually to see if there are any errors reported on screen that I’ve not picked up in a log entry. To do this stop the monitor process. Then (from the Sensors directory) type ‘sudo python3 as3935_monitor.py’ and see what happens. It might just sit with a blinking cursor. That’s good, it means it’s not dying! If after about 5 minutes you haven’t seen anything on screen then there’s nothing horribly wrong with the program. 5 minutes gives most of the major functions time to run and show any errors. You can kill the manually run program using Ctrl+C. Sometimes you need to use Ctrl+C twice depending on what it was doing at the time.

That looks pretty normal and has confirmed that 2 is the best value to use for your antenna. It’s a low value but perfectly valid. You could actually use any value from 0 to 12 because they’re all within the +/- 3.25% spec, but 2 is the best value to use and using other values won’t improve things.

It looks like it’s now down to adjusting watchdog_threshold and spike_rej to try to remove the false positives…or go hunting with a MW AM radio :wink:

I’ve made a start on v3.2. A few minor tweaks to the installer script and removed a couple of surplus lines in the calibration code.

A bigger change is that I’ve added the URLs /nowcast.json, /current_settings.json and /stats.json to access the data in JSON format for use in your own web pages, e.g. on another server or maybe to be downloaded using WD and then uploaded to an Internet web server for use in some Javascript there.

I’m not sure what to do about events data though. It can be a lot of data to process so I wouldn’t want to generate the data on schedule, just on demand (I’m assuming demand would be less frequent). Then there’s how much data to provide…the last ‘x’ events, or events in the last hour/last three hours or ??? Going above three hours may be a very lot of data and would also need some extra processing because current data is in one place, above 3 hours old data may be in the current data or archive and over 6 hours it will definitely be in the archive file. Also are all events needed, or just strokes and ignore disturbers and noises? I’m inclined just to do strokes in the last 3 hours because I assume most people want to know about real events and probably only whilst a storm is active (do many storms last more than 3 hours?) If you wanted data for a longer period you could just build your own database from the JSON data?

Hi Chris
update on pi3+

pi@raspberrypi:~ $ sudo pip3 freeze
automationhat==0.2.0
blinker==1.3
blinkt==0.1.2
buttonshim==0.0.2
Cap1xxx==0.1.3
chardet==2.3.0
click==6.6
colorama==0.3.7
colorzero==1.1
cryptography==1.7.1
drumhat==0.1.0
envirophat==1.0.0
ExplorerHAT==0.4.2
Flask==0.12.1
fourletterphat==0.1.0
gpiozero==1.5.0
idna==2.2
itsdangerous==0.24
Jinja2==2.8
keyring==10.1
keyrings.alt==1.3
MarkupSafe==0.23
microdotphat==0.2.1
mote==0.0.4
motephat==0.0.2
numpy==1.12.1
oauthlib==2.0.1
pantilthat==0.0.7
pgzero==1.2
phatbeat==0.1.1
pianohat==0.1.0
picamera==1.13
picraft==1.0
piglow==1.2.5
pigpio==1.46
Pillow==4.0.0
pyasn1==0.1.9
pycrypto==2.6.1
pygame==1.9.3
pygobject==3.22.0
pyinotify==0.9.6
PyJWT==1.4.2
pyOpenSSL==16.2.0
pyserial==3.2.1
python-apt==1.1.0b5
pyxdg==0.25
rainbowhat==0.1.0
requests==2.12.4
requests-oauthlib==0.7.0
RPi.GPIO==0.6.5
RTIMULib==7.2.1
scrollphat==0.0.7
scrollphathd==1.2.1
SecretStorage==2.3.1
sense-hat==2.2.0
simplejson==3.10.0
six==1.12.0
skywriter==0.0.7
sn3218==1.2.7
spidev==3.3
ssh-import-id==5.6
touchphat==0.0.1
twython==3.4.0
unicornhathd==0.0.4
urllib3==1.19.1
Werkzeug==0.11.15
pi@raspberrypi:~ $

pi@raspberrypi:~/Sensors $ sudo python3 as3935_monitor.py
Traceback (most recent call last):
File “as3935_monitor.py”, line 4, in
import socketio
ImportError: No module named ‘socketio’
pi@raspberrypi:~/Sensors $ sudo python3 as3935_web.py
Traceback (most recent call last):
File “as3935_web.py”, line 3, in
import eventlet
ImportError: No module named ‘eventlet’ commented out the lines suggested and tried again
pi@raspberrypi:~/Sensors $ sudo python3 as3935_web.py
Traceback (most recent call last):
File “as3935_web.py”, line 8, in
from flask_socketio import SocketIO, emit
ImportError: No module named ‘flask_socketio’
pi@raspberrypi:~/Sensors $
pi@raspberrypi:~/Sensors $ sudo python3 as3935_pigpio_test.py
Test starting
Good version of pigpio found - Version 77
Register 0x00 is 0x00
Register 0x01 is 0x00
Register 0x02 is 0x00
Register 0x03 is 0x00
Register 0x04 is 0x00
Register 0x05 is 0x00
Register 0x06 is 0x00
Register 0x07 is 0x00
Register 0x08 is 0x00
Test complete ran but those values do not look right
pi@raspberrypi:~/Sensors $ sudo python3 calibrate_pig.py
Starting calibration run - Please wait approximately 16 seconds
Failure - minimum variance ( 100.00 %) > 3.25% of LCO frequency looks like this has failed
pi@raspberrypi:~/Sensors $

i tried the calibrate for v1.3 and that worked

the log file you mention is not in the var/log folder so i assume not created yet
something clearly has not worked on raspian stretch with python 3.5

Harold

Which socket are you using? You haven’t put a socket number after as3935_pigpio_test.py. It defaults to socket 1 so if you’re using socket 2 that would give all zeroes.

I’m wondering whether the error about the wrong version of Python for the eventlet module has stopped the other required module from loading. Do ‘sudo pip3 install Flask-SocketIO’ and then try starting both services again. This module is required and seems to be missing from your ‘pip3 freeze’ list.

Actually that should only affect the web server but you still need to do it.

Also do ‘sudo pip3 install python-socketio’. That doesn’t seem to be included in Stretch and should hopefully get the monitor service to run. I’ve added these extra modules to the v3.2 installer scripts so it will be done automatically in future.

The existence of the eventlet module is now checked for in v3.2 and the monkey_patch() function only used if the module is available.

Hi Chris
installed those 2 files and did a manual run
monitor seem to run ok
pi@raspberrypi:~/Sensors $ sudo python3 as3935_monitor.py
^CException in thread Thread-3:
Traceback (most recent call last):
File “/usr/lib/python3.5/threading.py”, line 914, in _bootstrap_inner
self.run()
File “/usr/local/lib/python3.5/dist-packages/pigpio.py”, line 1213, in run
cb.func(cb.gpio, newLevel, tick)
File “as3935_monitor.py”, line 92, in register_event
reason = as3935.get_interrupt()
File “/home/pi/Sensors/RPi_AS3935_PIGPIO.py”, line 114, in get_interrupt
self.read_data()
File “/home/pi/Sensors/RPi_AS3935_PIGPIO.py”, line 350, in read_data
del self.registers[0]
IndexError: list assignment index out of range message after first ctrl C

^CException ignored in: <module ‘threading’ from ‘/usr/lib/python3.5/threading.py’>
Traceback (most recent call last):
File “/usr/lib/python3.5/threading.py”, line 1288, in _shutdown
t.join()
File “/usr/lib/python3.5/threading.py”, line 1054, in join
self._wait_for_tstate_lock()
File “/usr/lib/python3.5/threading.py”, line 1070, in _wait_for_tstate_lock
elif lock.acquire(block, timeout):
File “as3935_monitor.py”, line 75, in sig_handler
as3935.close()
File “/home/pi/Sensors/RPi_AS3935_PIGPIO.py”, line 18, in close
self.spi.spi_close(self.as3935)
File “/home/pi/Sensors/pigpio_spi_handles.py”, line 78, in spi_close
super().spi_close(handle)
File “/usr/local/lib/python3.5/dist-packages/pigpio.py”, line 3951, in spi_close
return _u2i(_pigpio_command(self.sl, _PI_CMD_SPIC, handle, 0))
File “/usr/local/lib/python3.5/dist-packages/pigpio.py”, line 1011, in _u2i
raise error(error_text(v))
pigpio.error: ‘unknown handle’
pi@raspberrypi:~/Sensors $ message after second ctrl C

web gave this at end but seems to run ok

127.0.0.1 - - [30/Jul/2020 14:23:35] “POST /socket.io/?transport=polling&EIO=3&sid=15f65de9fbff4794a6db3bce3efdc963 HTTP/1.1” 200 -
127.0.0.1 - - [30/Jul/2020 14:23:35] “GET /socket.io/?transport=polling&EIO=3&sid=15f65de9fbff4794a6db3bce3efdc963&t=1596115415.1678898 HTTP/1.1” 200 -
^C^CException ignored in: <module ‘threading’ from ‘/usr/lib/python3.5/threading.py’>
Traceback (most recent call last):
File “/usr/lib/python3.5/threading.py”, line 1288, in _shutdown
t.join()
File “/usr/lib/python3.5/threading.py”, line 1054, in join
self._wait_for_tstate_lock()
File “/usr/lib/python3.5/threading.py”, line 1070, in _wait_for_tstate_lock
elif lock.acquire(block, timeout):
KeyboardInterrupt
pi@raspberrypi:~/Sensors $ took 2 ctrl C’s

Harold
You can ignore any errors after you’ve used Ctrl+C to end a program. They’re effectively screams from the programs after you’ve just stabbed them in the back :wink:

If you ignore those it sounds like both monitor and web are working ok on the Pi3 now?

Hi Chris
looks promising on pi3+ but the log as3935_monitor.log is 6mb in size and most of it is
2020-07-30,13:52:36.536 : as3935_monitor - register_event - ERROR: Unknown reason in register_event() - 0
2020-07-30,13:52:36.539 : as3935_monitor - register_event - ERROR: Unknown reason in register_event() - 0
2020-07-30,13:52:36.542 : as3935_monitor - register_event - ERROR: Unknown reason in register_event() - 0
2020-07-30,13:59:51.518 : as3935_monitor - register_event - ERROR: Unknown reason in register_event() - 0
2020-07-30,14:07:54.912 : as3935_monitor - sig_handler - WARNING: Exiting due to SIGTERM these lines are after i rebooted
2020-07-30,14:07:54.953 : as3935_monitor - sig_handler - WARNING: Exiting due to SIGTERM
2020-07-30,14:10:34.479 : as3935_monitor - as3935_processing - INFO: Starting as3935_monitor
2020-07-30,14:10:34.484 : as3935_monitor - as3935_processing - INFO: Tuning capacitor set to 104pF
2020-07-30,14:10:34.484 : as3935_monitor - as3935_processing - INFO: Initial noise floor is set to 0
2020-07-30,14:10:34.484 : as3935_monitor - as3935_processing - INFO: Location is set to indoors
2020-07-30,14:10:34.485 : as3935_monitor - as3935_processing - INFO: Mask disturbers is False
2020-07-30,14:10:34.485 : as3935_monitor - as3935_processing - INFO: Miniumum strikes for detection is 1

does this log file get purged at some point
there is the odd register event error in the pi4 log but that file is only 28kb

Thanks
Harold

The log rotates weekly and 4 weeks of logs are kept so it will be a lot of logs after a month.

However, you’re seeing the same reason 0 responses that Asobig sees too and if your Pi4 isn’t seeing the same things then it looks like there might be something in the code that’s causing them. I’ll keep looking for ideas to see if I can find more things to try.