Ok wim path seems settled,
but i didn’t realize i had to remove {WEBROOT} hahahah
Now I have another problem I am attaching photos
Thanks a lot Wim

Ok wim path seems settled,
but i didn’t realize i had to remove {WEBROOT} hahahah
Now I have another problem I am attaching photos
Thanks a lot Wim
You can upload the Arial font family from Windows to /jpgraph-4.2.10/src/fonts or you can use the fonts provided.
Downloaded the font now works
thank you so much…
![]()
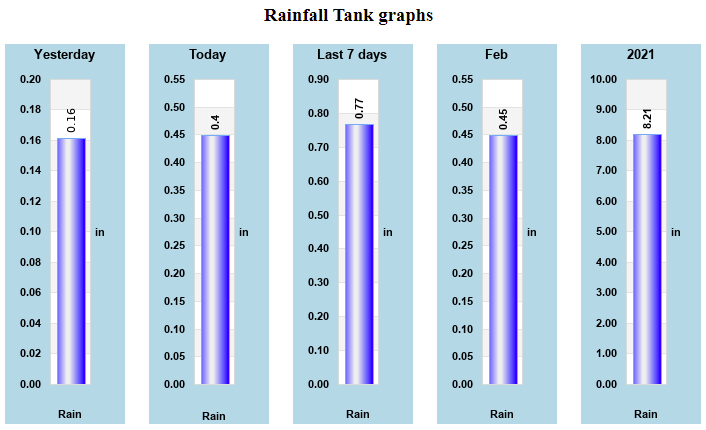
is only showing .1 digit after the decimal point where the other gauges of the same type show 2
Rain
Today: 0.02 Inches @ 7:08 AM where the graph says .0
Now today it is not showing at all now, I have made no changes
OK so your daily rain in the clientraw file is showing 0 rain for today and clientrawextra for yesterday is also 0 so the graphs display as empty which is how it should display. If you actually had rain in the past two days you need to fix WD so that the correct values populate the clientraw set of files, or perhaps the graphs are reading the wrong files. Anyway there is nothing wrong with the graphs I can see.
Stuart
Please note that there is a new(ish) version of JPGraph 4.3.4 I have tested this and the graphs work OK for me now. However be aware that if you have libgd v2.3.0 on your linux system there is a bug in it which causes all graphs to fail with an erroneous font failure message, it took me ages to chase it down and there is a bypass available by editing the gd_image.inc.php file. I have some ore testing to do and if all is well I will make the edited version of this file available to anyone who has this problem, but be aware this module belongs to JPGraph and is only a temporary fix until libgd is fixed. Also note earlier versions of JPGraph also fail if you update libgd to 2.3.0.
Stuart
Update: I have tested my edit some more on the gd_image.inc.php file and all is well. If anyone needs it and the have libgd at v2.3.0 in Linux and find their graphs failing please PM me and I will arrange for you to have a copy of the file pending the official fix to libgd.
Update #2: Looking into the error I believe that libgd3 may be working as designed and so I have reported the issue to JPGraph directly in the hope they will fix it in their code.
Not sure if the this is the right place to put this but, I am having issues with wxnoaa scripts. My wx graphs test page all works correctly. I am using 4.3.0 version. The temp page works but the rain and wind pages are not working. Here are the three pages I am referring too.
https://www.goblesweather.com/wxnoaatemps.php
https://www.goblesweather.com/wxnoaarain.php
https://www.goblesweather.com/wxnoaawind.php
Thanks,
Chuck
Charles I am unable to help with this. I’d suggest opening a new thread for this as to help you need to have the actual PHP scripts creating these graphs and have no way of testing them here as I do not use them. This thread is primarily for JPGraphs and my script package.
Stuart
Mods could you take Charles’ update and convert it to its own thread please? You can then remove this update if you wish. Thanks
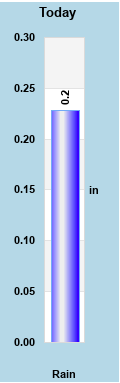
@dsscheibe’s first post referred to the number of decimal places displayed on the Today rain tank graph, and his post elsewhere clearly showed the problem at the time.
I took this screenshot from someone else’s test page today and it is clearly labelled 0.2 in despite showing something like 0.23 in.
There are options in graphsconf.php to set the format for rain, on these tanks for the value inside the tanks it currently uses $rain_format and not the one of either inches or metric so that needs to be changed to the correct value for 2 decimal places. When I get time I will make the changes needed and update the package but it may be a few days.
Stuart
This is the issue when you only use metric sometimes stuff is missed in testing. About time the USA came into the 21st century and switched to metric ![]() :roll: #-o
:roll: #-o
Stuart
Update: I have uploaded a new wxgraphs.zip for download which contains the fix for rain today tank graph not showing two digits inside the tank when using Imperial measurements.
In relation to my earlier comments about the libgd3 bug the developers have issued an update which should fix this, so if anyone has this problem you need to obtain libgd3 V2.3.1 which should fix it, it is very new and will probably be a few weeks before it appears on any updates to Linux.
Stuart
I presume that fix is to replace line 83:
$bplot->value->SetFormat("$rain_format");
with lines 83-88:
    if ($rain_conv == 1) {
        $bplot->value->SetFormat("$rain_Mformat");
        }
    if ($rain_conv != 1) {
        $bplot->value->SetFormat($rain_Iformat);
        }
Is that right?
Were there many more changes? I only ask because it would be a pity for a current user to have to download a full set of graphs if they only need to change this one.
The simplest thing is to just unzip the file to a temporary directory and copy the rain_today.php file only to their graphs directory. I never recommend editing the file just in case an error creeps in.
Stuart
ok, downloaded and extracted raintoday now just need to get some more rain.
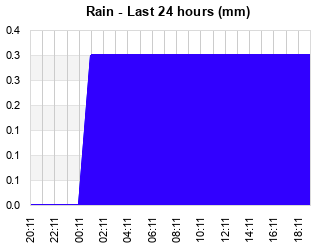
Rain values look a bit odd on the y-axis of my V3.0 “Rain last 24 hours” graph. Can you point me in the right direction to sort this?
I also have occasional problems with “Barometer last 24 hours” because the y-axis does not auto-adjust.
Using JPGraphs 4.2.10 and PHP 7.2.1.
Regarding the rain values it is simply reading from the clientraw set of files, you need to look at this data and can use the parser on Ken’s Saratoga website to display this which makes life a lot easier that reading the data string!
As for the barometer it does not autoscale, there are max & min values in graphsconf.php which allow you to set appropriate max & min values for your location and expected values.
Stuart
Re rain, I meant that the y-axis labelling is strange: 0.0, 0.1, 0.1, 0.1, 0.2, 0.3, 0.3, 0.4 mm?
Re baro, OK.