JPGraph-Need help configuring

Hello Pinto,

you had it wrong, but I corrected it, and it is working now here:

http://www.gateway2capecod.com/wxgraphs/temp_hum.php

you said to add this:

$lineplot.->SetFillColor(“[email protected]”);

But it was suppose to be this:

$lineplot2->SetFillColor(“[email protected]”);

(the “.” needed to be a “2”, after the word linplot)

go on like that, you will become an expert :slight_smile:

Hello Pinto,

LOL,…I"m Far from an expert,… but learning more and more as time goes on.

I managed to edit most of the grapghs color’s, inside and out…have a look:

http://www.gateway2capecod.com/wxgraphs/wxgraphs_test.html

Thanks again, Chris

good job, but 8O those colors

well…I am still in the testing phaze…

using the interval of 4 and the angle of 0…in the graphconfig, looks better than the slanted times I had, but I gotta get the times for the recent 24 hour graphs to look as good as the times, which are actually days,…like the monthly graph’s bottom line shows, only as hour’s, not days. I almost had it right but still need to work on it more.

Chris

Hello,

I was wondering if anyone can have a look at the code for my temp_hum.php (Last 24 hours of temp & humidity graph) seen here:

http://www.gateway2capecod.com/wxgraphs/temp_hum.php

and tell me why my bottom Axis line is currently displaying “1-3-5-7-9-11-13-15-17-19-21-23” ? This is the correct layout for time scale I want to use, BUT…it doesnt seem to be set to the correct times. as of right now it is 11:30 am EST and I believe instead of the above time plots, it should be reading something like this:
“11-13-15-17-19-21-23-1-3-5-7-9-11” showing the most recent last 24 hours

I have included my temp_hum.php file as attachment below…Thanks, Chris


temp_hum.txt (4.17 KB)

if it helps any for figuring out why my bottom axis is stuck at the 23 hour, here is what my time array looks like inside the temp_hum.php file, the graph itself is updating inside, just not the time/hour scale at bottom:

//calculate timearray for the x-axis
$n=1;
$limit=24;
$time=date(" H",time());
//$time=$time+2;//if your server is in another timezone,remove first two slashes and add or substract the diff
$datat=array($time);
$x=$datat;
//what you have to add
$add=3600;
$result=strtotime($time);
for ($n=1;$n++;)
{
$result=($result-$add);
$new=date(‘ga’, $result);
$next=array(“$new”);
$datat= array_merge ($next,$datat);
if ($n>=$limit) break;
}
$datax=array_merge($datat,$x);
//end of hour calculation
// Create the graph and specify the scale for both Y-axis
$graph = new Graph($xsize,$ysize,“auto”,30);
$graph->SetScale(“textlin”);
$graph->SetY2Scale(“lin”,0,100);
$graph->SetShadow();
$graph->SetMarginColor(“$margincolour”);
$graph->img->SetAntiAliasing(“$antialias”);

The function you have is producing an array that looks like:

    [0] => 6pm
    [1] => 7pm
    [2] => 8pm
    [3] => 9pm
    [4] => 10pm
    [5] => 11pm
    [6] => 12am
    [7] => 1am
    [8] => 2am
    [9] => 3am
    [10] => 4am
    [11] => 5am
    [12] => 6am
    [13] => 7am
    [14] => 8am
    [15] => 9am
    [16] => 10am
    [17] => 11am
    [18] => 12pm
    [19] => 1pm
    [20] => 2pm
    [21] => 3pm
    [22] => 4pm
    [23] =>  14

Somehow, I don’t thing that is what you are looking for.

Hello Kevin,

what I am trying to do, is make mine look like the ones on this page from finlands weather site:
http://saa.ekiwx.net/asema/clientraw/graphs.php

notice the top 3 grapgh’s he has…they are in the 23-21-19 etc hour format. I would also settle for the 11pm-9pm-7pm etc. look.

One Important thing to note is that, he must have his interval set to update at every 2 hours, in his graphconfig.php, as I have watched them for past few hours and notice the changes to the bottom axis hour’s

Currently his local time is around midnight, so since his most recent hour says 23, it is correct, at the time of me writing this message. if you check back about 2 hours from now, say 7 pm EST, Then his will say from the 1am time of 1-23-21-19 etc

I currently have mine set almost identical, but for whatever reason, mine have not moved from the 23-21-19 hour spots, although my actual graph inside is updating.

in my graphconfig.php. I currently have my interval time set to number 4, but it never originally showed my grapgh at the correct begging times, and has not changed since I uploaded it, other than the actual data inside the graph.

the person who has this running on their site in finland sent me a copy of their original temp_hum.php file, so I tried to copy it, and make necessary changes to get mine similiar, everything is working except the X Axis time at bottom of the grapgh.

included in this reply is their actual temp_hum.php
and also mine as I have it configured now.

maybe someone can figure out exactly where I went wrong


finland_temp_hum.txt (4.62 KB)

chris_temp_hum.txt (4.2 KB)

I also wanted to mention I have mine here:
http://www.gateway2capecod.com/wxgraphs/temp_hum.php

I also have another one I am testing out here, that has a different time layout, But is working at the 4 hour intervals:
http://www.gateway2capecod.com/wxgraphs/temp_hum3.php

Why make life more difficult for yourself. My original temp_hum.php loads up the time stamps from the fields in the clientrawextra.txt file. Simply modofy these values to select only the hour part.

Change each of the statements like this one

$clientrawextra[‘459’]

to

substr($clientrawextra[‘459’],0,2)

there should be 24 of them going from 459 to 478 then 578 to 581

Stuart

Hello stuart,

well I can give that a try also. I wasnt aware that I could do it that way.

Thank you for the help, Chris

Hello stuart,

I took an original copy of the temp_hum.php and edited the temp array as follows:

//create timearray for the x-axis
$x=array(substr($clientrawextra[‘459’],0,2),substr($clientrawextra[‘460’],0,2),substr($clientrawextra[‘461’],0,2),substr($clientrawextra[‘462’],0,2),substr($clientrawextra[‘463’],0,2),substr($clientrawextra[‘464’],0,2),substr($clientrawextra[‘465’],0,2),substr($clientrawextra[‘466’],0,2),substr($clientrawextra[‘467’],0,2),
substr($clientrawextra[‘468’],0,2),substr($clientrawextra[‘469’],0,2),substr($clientrawextra[‘470’],0,2),substr($clientrawextra[‘471’],0,2),substr($clientrawextra[‘472’],0,2),
substr($clientrawextra[‘473’],0,2),substr($clientrawextra[‘474’],0,2),substr($clientrawextra[‘475’],0,2),substr($clientrawextra[‘476’],0,2),substr($clientrawextra[‘477’],0,2),
substr($clientrawextra[‘478’],0,2),substr($clientrawextra[‘578’],0,2),substr($clientrawextra[‘579’],0,2),substr($clientrawextra[‘480’],0,2),substr($clientrawextra[‘481’],0,2));
$datax = $x;

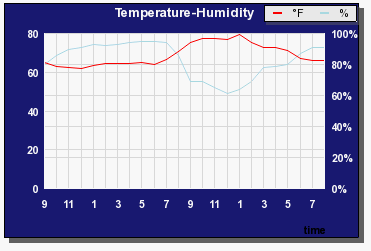
and now I have this:

http://www.gateway2capecod.com/wxgraphs/temp_hum.php

Looks like it is working, at a 4 hour interval, as my time is almost 7pm EST Zone

Next question is why do some of the hour times have a : next to them? did I edit something wrong and how do I fix?

Thank you, Chris

I would guess it’s because your times aren’t in 24 hour format and you are taking the first 2 characters - which will include the colon if the hour is only a single digit.

Hello Niko,

well that kinda makes sense, and maybe it would be better looking if I was to use the 24 hour format instead.

is the setting to change it to the 24 hour format in the graphsconfig.php or is it in each actual script?

you guys sure know alot about this PHP Stuff, and I appreciate all the guidance you have given me.

Thank you, Chris

Your array is wrong… You go from 579 to 480… should have been 580

You might try something a bit easier… PHP is a programming language…

$datax = array();
for ( $i=459; $i<479; $i++) {
	$datax[] = intval( substr($clientrawextra[$i], 0, 2) );
}
for ( $i=478; $i<582; $i++) {
	$datax[] = intval( substr($clientrawextra[$i], 0, 2) );
}

Don’t have to worry about 12 or 24 hour values.

I haven’t run this but it should work.

Hello kevin, I got it working…Thanks!

Nice shortcut than typing in all those “substr($clientrawextra[‘469’],0,2),”…even though I already did that once.

you said to use the code:

$datax = array();
for ( $i=459; $i<479; $i++) {
$datax = intval( substr($clientrawextra[$i], 0, 2) );
}
for ( $i=478; $i<582; $i++) {
$datax = intval( substr($clientrawextra[$i], 0, 2) );
}

but it actually needed to be this:

$datax = array();
for ( $i=459; $i<479; $i++) {
$datax = intval( substr($clientrawextra[$i], 0, 2) );
}
for ( $i=578; $i<582; $i++) {
$datax = intval( substr($clientrawextra[$i], 0, 2) );
}

once I changed the 478 to a 578, it works and shows every hour in correct alignment and in correct actual time, as it should be. hopefully it keeps on working. I have made many backup copies today of all my testing.

Thanks, chris

Well it is only showing every other time… so 12 values instead of 24.

It starts off with an odd number…

The data in your datafile (clientrawdaily.txt) has this in it, which appears to match to me…

`459 TimeStamp Hour 01 T 9:40PM
460 TimeStamp Hour 02 T 10:40PM
461 TimeStamp Hour 03 T 11:40PM
462 TimeStamp Hour 04 T 12:40AM
463 TimeStamp Hour 05 T 1:40AM
464 TimeStamp Hour 06 T 2:40AM
465 TimeStamp Hour 07 T 3:40AM
466 TimeStamp Hour 08 T 4:40AM
467 TimeStamp Hour 09 T 5:40AM
468 TimeStamp Hour 10 T 6:41AM
469 TimeStamp Hour 11 T 7:41AM
470 TimeStamp Hour 12 T 8:41AM
471 TimeStamp Hour 13 T 9:41AM
472 TimeStamp Hour 14 T 10:41AM
473 TimeStamp Hour 15 T 11:41AM
474 TimeStamp Hour 16 T 12:41PM
475 TimeStamp Hour 17 T 1:41PM
476 TimeStamp Hour 18 T 2:41PM
477 TimeStamp Hour 19 T 3:41PM
478 TimeStamp Hour 20 T 4:41PM

578 TimeStamp Hour 21 T 5:41PM
579 TimeStamp Hour 22 T 6:41PM
580 TimeStamp Hour 23 T 7:41PM
581 TimeStamp Hour 24 T 8:41PM`

The “current” image is attached as time keeps moving and the values will change.


well,…They are all working now…Using the code from kevin made it a bit easier to edit the files.

They can all be seen here,…although I am still working on the final color’s before I make some of these a permanent part of my website:

http://www.gateway2capecod.com/wxgraphs/wxgraphs_test.html

Lets all go have A beer now…I am Buying :wav:

Good work gateway2capecod :wink: