That’s interesting…it’s gone up to $709 now!
… and I think it’s basically the thermopile design linked to in my post above.
It may be a case of no competition so the price can be whatever they want to set?
Maybe astronomers are used to paying a lot for their toys?
Site shows $749 now…geesh! :?
They use a lot of GAS to make it… #-o
there is another thread, and ricky has posted that he has made one up, and its working with WD via a labjack, and he has it plotting on the WD main screen graph!
see:
http://www.portunus.net.nz/weather/Prime.htm
i.e it trends opposite to the solar sensor…and was working during the night hours too!
Am I looking at the wrong line? Looks to be following the solar…

During the day it should plot similar to solar I would think since clouds overhead would cause solar to drop along with the “temp” telling the sensor there is a cloud overhead. right?
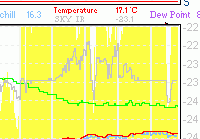
its the grey line
and its going in opposite to the yellow solar line
i.e when its cloudy the yellow lines goes down, and the grey line goes up, i.e inverse relationship ![]()
hummm
i now have it back to front…i am sure thats the way it was plotting …
but at least its working (becuase its working in tandem with the solar reading ![]() )
)
Need to see what it looks like at night with intermittent clouds. If it makes the same types of swings it might indicate it is working.
There it still would be effected by temp, but you should still see the swings.
there is the early hours of the morning visible on the graph still now…
and there is some trends
but ricky confirmed in the other thread it did do a spike when a cloud move over, so he said its working ![]()
gotta run…
Yes, i have it set up as higher on the graph is warmer sky realtive to ground… and it has been following the solar levels all day… i think the field of view down the tube is such that it has yet to get any direct sun on the sensor being winter, well almost spring, here ![]()
Anyway the clear sky didnt last long enough after i put it up last night but as the cloud moved in the reading went up substantially and there was good variation as the Sc partial cloud cover varied… now all I need is a good clear night and I should have a pretty good idea of the values!
sky clearing from the south here now ricky, which should move over your way this eveninng ![]()
had a brief partial break in the cloud but its back now… did show up on the graph ![]()
from what i can see from today, there is a level that corresponds to cloudy and its the same day or night. Clear sky at night goes lower than that and clear sky day goes higher… On my graph the sun is high enough between 11am and 1:30pm to actually shine on the sensor plate and that caused an extra lift over that time as well…
Oh and the big dip around 4pm was where the sensor pipe fell off the trellis I had taped it to lol …has cable ties now
Very nice Ricky! Not familiar with labjack, but with kind of added feature, I’m going to check into it. Is there or will there be a comprehensive and detailed write up on the proses you used? If you have some spare time of course.
Kris
Someone prove me wrong, but a cheap way to work out cloud cover is to use temperature drop at night time.
Temperature here is dropping at 0.7c per hour and for sure its almost clear skies
Temperature drop is probably too slow to make a quick assessment of cloud cover though. 0.7degC/hour is around 0.1degC/10 minutes and that’s about the minimum that many temp sensors will record (with a margin of error). If you’ve got broken cloud with a brisk wind you won’t spot the gaps in the cloud.